Reducing present atmospheric CO2 to 350 ppm is needed to avert irreversible climate catastrophe, top climate scientists say
Dr. Mae-Wan Ho
Rajendra Pachauri, United Nation’s top climate scientist and head of the Intergovernmental Panel on Climate Change (IPCC), took everyone by surprise when he said that the target to aim for is 350 parts per million (ppm) CO2 in the atmosphere, bearing in mind that we now have 385 ppm.
The IPCC produces an authoritative assessment of climate science every five years. Its last report in 2007 helped set the target of 450 ppm that many environmental groups and national governments have adopted as their goal for the Copenhagen negotiation this December.
But 450 ppm is out of date. When Jim Hansen from NASA Goddard Institute for Space Studies, New York, in the US and other scientists looked at phenomena such as how rapidly polar ice has been melting in summer [1], they produced a convincing demonstrating that 350 ppm is the bottom line. “But it's been hard to get that news out to the powers that be. So today it comes as enormous and welcome news that Pachauri, from his New Delhi office, said that 350 was the number,” [2] wrote Bill McKibben, prominent author and environmentalist.
Concern about global warming due to greenhouse gases (GHGs) led to the United Nations Framework Convention on Climate Change [3] that has the objective of stabilizing GHGs in the atmosphere at a level preventing “dangerous anthropogenic interference with the climate system.”
In its 2007 report [4], the IPCC estimates that global warming of more than 2-3 °C may be dangerous. The European Union adopted 2 °C above pre-industrial global temperature as a goal. This and other considerations led to the 450 ppm CO2 maximum target.
But Hansen and colleagues [5] point out that IPCC climate models are inadequate, as they include only fast feedback processes, which gives ~ 3 °C warming for doubled CO2, a figure referred to as ‘climate sensitivity’. Instead, the more realistic climate sensitivity that includes also slow feedback processes is ~6 °C for doubled CO2. The earth’s history shows that this doubling of CO2 covers the range of climate states between glacial conditions and ice-free Antarctica.
The decrease from a high atmospheric CO2 was the main cause of a cooling trend that began 50 million years ago, when the planet remained nearly ice-free until CO2 fell to 450 ± 100 ppm. Hansen’s team point out that unless we have prompt policy changes, the critical level of atmospheric CO2 will be passed in the opposite direction - glacial to ice free - within decades. “Paleoclimate evidence and ongoing climate change suggest that CO2 will need to be reduced from its current 385 ppm to at most 350 ppm, but likely less than that.” They wrote.
They suggest this target may be achievable by phasing out coal use, except where CO2 is captured; and adopting agricultural and forestry practices that sequester carbon.
If the present overshoot of this target CO2 is not brief, there is a possibility of seeding “irreversible catastrophic effects”.
The first indication that the IPPC models are inadequate is that they fail to capture the rapid summer melting of polar ice caps for the past several years. That, together with paleoclimate data, alerted Hansen’s team to the importance of ‘slow’ processes feeding back on climate that are not taken into account in most climate models. These slow processes include ice sheet disintegration, vegetation migration, and GHG release from soils, tundra or ocean sediments, which may begin to come into play on ‘longer’ time scales that are as short as centuries or less.
The team used paleoclimate data to show that long-term climate has high sensitivity to human induced GHGs, which is not captured by current IPPC models; and that the present global mean CO2 of 385 ppm is already in the dangerous zone.
Despite the rapid current CO2 growth at ~2 ppm/year, it is conceivable to reduce CO2 this century to less than the current amount, but only via prompt policy changes.
The idealized ‘climate sensitivity’ was originally defined by asking how much global surface temperature would increase if atmospheric CO2 were instantly doubled, assuming that slowly-changing planetary surface conditions, such as ice sheets and forest cover, were fixed. Long-lived GHGs, except for the specified CO2 change, were also fixed and not responding to climate change. This provides a measure of climate sensitivity including only the effect of ‘fast’ feedback processes, such as changes of water vapour, clouds and sea ice.
Classification of climate change mechanisms into fast and slow feedbacks is useful, even though the time scales of these changes may overlap. The climate sensitivity estimated with climate models using only fast feedback processes is 3 ± 1.5°C. Water vapour increase and sea ice decrease in response to global warming were both found to be strong positive feedbacks, amplifying the surface temperature response.
Climate models alone are unable to define climate sensitivity more precisely, because it is difficult to prove that models realistically incorporate all feedback processes. The history of the earth however, provides independent data for checking the models and whether the appropriate fast and slow feedback processes have been included.
The atmospheric composition and surface properties of the planet in the late Pleistocene (2 million to 11 000 years bp (before present)) are known well enough for accurate assessment of the climate sensitivity. The team first compared the conditions at two time points, the pre-industrial Holocene (the last 10 000 years) with the last glacial maximum (LGM, 20 000 y bp). The planet was in energy balance (equilibrium) in both periods. The approximate equilibrium characterizing most of Earth’s history is unlike the current situation, in which GHGs are rising through human activities at a rate much faster than the coupled climate system can respond.
Climate forcing in the LGM state due to the ice age surface properties, i.e., increased ice area, different vegetation distribution, and continental shelf exposure, was -3.5 ± 1 W/m2 relative to the Holocene (negative forcing represents cooling). Additional forcing due to reduced amounts of long-lived GHGs (CO2, CH4, N2O), including the indirect effects of CH2 on trophosphere (lowest layer of the atmosphere) ozone and stratosphere (next layer up of atmosphere) water vapour was -3 ± 0.5 W/m 2. The total -6.5 W/m2 forcing and global surface temperature change of -5 ± 1°C relative to the Holocene give an empirical sensitivity ~¾ ± ¼ °C per W/m2 forcing, i.e., a sensitivity of 3 ± 1°C for the 4 W/m2 forcing of doubled CO2. This empirical fast-feedback climate sensitivity allows water vapour, clouds, aerosols, sea ice, and all other fast feedbacks that exist in the real world to respond naturally to global climate change.
Climate sensitivity varies as Earth becomes warmer or cooler. Toward the colder extremes, as the area of sea ice grows, the planet approaches runaway snowball-Earth conditions, and at high temperatures it can approach a runaway greenhouse effect. At its present temperature Earth is on a flat portion of its fast-feedback climate sensitivity curve in between the two extremes.
The empirical fast-feedback climate sensitivity, derived by comparing conditions at two points in time, was checked over the longer period of time using CO2 and CH4 data from the Antarctic Vostok ice core and sea level from the Red Sea sediment cores. The results are presented in Figure 1. The temperature from ‘Observations’ (Fig. 1c) is Antarctic temperature change divided by two (as rough approximation of global average) ‘Calculated’ global temperature change is based on fast feedback climate sensitivity of ¾ °C /W/m2.
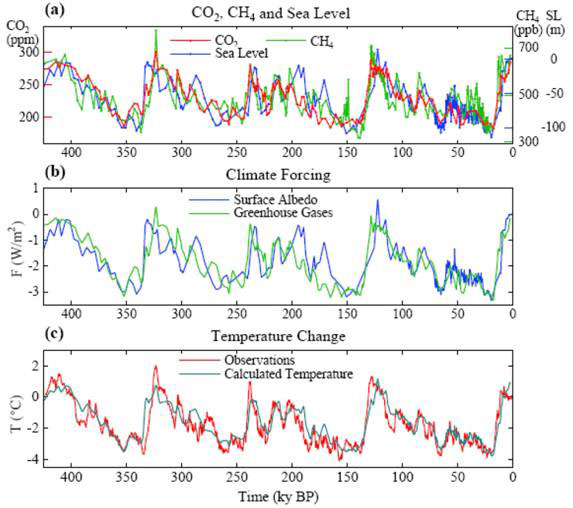
Figure 1. Matching IPPC model to data from ice and sediment cores
As can be seen, the calculated and observed temperatures do not coincide well. Models with fast feedback only cannot account for the temperature changes. GHGs and surface albedo changes are mechanisms causing the large global climate changes, but they do not initiate these climate swings. Instead changes of GHGs and sea level (a measure of ice sheet size) lag behind temperature change by several hundred years. GHG and surface albedo changes are positive climate feedbacks. Increased albedo from ice melting increases warming causing more ice to melt, while decreased albedo from ice sheets decreases warming, causing more ice sheets to form; Similarly, GHG induced warming results in further releases of GHGs due to out-gassing from the oceans and further warming, while decrease in atmospheric GHG results in cooling and further GHG declines from enhanced solubility in the cooled ocean water.
Plotting GHG forcing from ice core data against temperature changes shows that global climate sensitivity including the slow surface albedo feedback is s 1.5 °C /W/m2, or 6 °C for doubled CO2, twice as large as the fast-feedback sensitivity. The timescale is expanded for the industrial era post 1850, and the plot includes GHG as well as non-GHG forcings and the global temperature. Notice that the curves in the industrial era do not coincide, as indicative of an out-of-equilibrium situation.
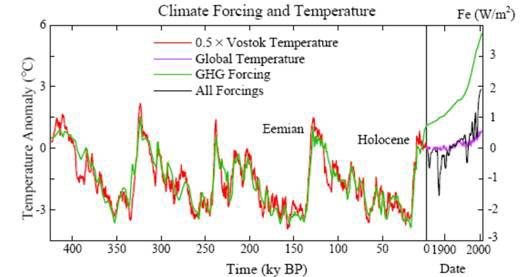
Figure 2 Climate forcing and temperature form Pleistocene to the present
How long does it take to reach equilibrium temperature with a specified GHG change? The response is slowed by ocean thermal inertia (the ocean taking longer to heat up than the land) and the time needed for ice sheets to disintegrate. Using a coupled atmosphere-ocean model, it is estimated that one-third of the response occurs in the first few years, in part because of rapid response over land. One-half occurs in ~25 years, three quarters in 250 years, and nearly full response in a thousand years. The ocean-caused delay is a strong quadratic function of climate sensitivity (goes up as square of climate sensitivity) and depends on the rate of mixing of surface and deep water.
Ice sheet response time is often assumed to be several thousand years, based on sea level changes far back in the earth’s history. However, those long term effects may reflect influences due to the slowly changing orbit of the earth, rather than inherent inertia in ice sheet response, as there is no discernable lag between the maximum rate of ice sheet melting and local absorption of the sun’s energy that favours melting. Paleontological sea level data with high time resolution reveal frequent sea level changes at rates of 1m/century or more.
Current observations of Greenland and Antarctica show increasing surface melt, loss of buttressing ice shelves, accelerating ice streams, and increasing overall mass loss. These rapid changes are not captured in existing ice sheet models, “which are missing critical physics of ice sheet disintegration,” Hansen and colleagues said. Sea level changes of several metres per century occur in the paleoclimate record in response to slower and weaker forcings than the present anthropogenic forcings. “It seems likely that large ice sheet response will occur within centuries, if human-made forcings continue to increase. Once ice sheet disintegration is underway, decadal changes of sea level may be substantial.”
The expanded time scale for the industrial era (Fig. 2) reveals a growing gap between the actual global temperature (purple curve) and equilibrium (long-term) temperature response based on net estimated climate forcing (black curve). Ocean and ice sheet response times together account for the gap, which is now 2 °C.
The forcings in Fig. 2 for the industrial era (black curve) when used to drive a global climate model yields global temperature change that agrees closely with observations (purple curve). But even that climate model, which includes only the fast feedback has additional warming of ~ 0.6 °C in the pipelines because of ocean thermal inertia. The remaining gap to equilibrium temperature is ~1.4 °C due to the slow surface albedo feedback, specifically the ice sheet disintegration and vegetation change.
The Cenozoic era, beginning 65.5 My bp, provides a complement to the Pleistocene for exploring climate sensitivity.
The Cenozoic data are not precise but larger variations occur, including an ice-free planet. At times with negligible ice sheets, oxygen isotope change d18O provides a direct measure of deep ocean temperature, Tdo (see Fig. 3). The lighter 16O evaporates preferentially from the ocean and also accumulates in ice sheets during glaciation. Thus, the rapid increase of d18O at about 35 My is associated with glaciations of Antartica. From then until the present, 18O in deep ocean foraminifera is affected by both ice volume and Tdo.
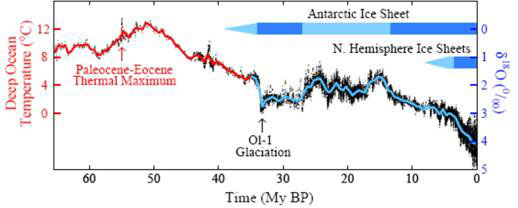
Figure 3. Temperature changes since the Cenozoic 65 My bp
The large Cenozoic temperature change (~14°C) between 50 My and the ice age at 20 000 years (LGM) must have been forced by changes of atmospheric composition, as no other forcings could have had such a big effect. CO2 concentration varied from ~ 180 ppm in glacial times to 1 500 + 500 ppm in the early Cenozoic, a forcing of more than 10 W/m2, an order of magnitude larger than other known forcings. CO2 was ~450 ± 100 ppm when Antarctica glaciated 35 My bp. That point in time (see arrow in Fig. 3) is of particular significance, as it marks the transition between an ice-free and a glaciating earth, and it is important to check if the CO2 level was indeed 450 ± 100 ppm.
There is a great deal of uncertainty in the proxy measures of CO2 that far back in the earth’s history. Nevertheless, the data indicate that CO2 was of the order of 1 000 ppm in the early Cenozoic but <500 ppm in the last 20 My. By specifying CO2 at 35 My as ~450ppm and running their climate model assuming that CO2 provides 75 percent of the GHG forcing as in the later Pleistocene, Hansen’s team was able to reproduce the range of early Cenozoic proxy CO2 data. Furthermore, it yielded a good fit to the amplitude and mean CO2 level in the late Pleistocene.
Thus, the Cenozoic data suggest that CO2 was the dominant forcing, that CO2 was ~450 ± 100 ppm when Antarctica glaciated, and that glaciations is reversible, as ~450 ± 100 ppm straddles both the ice-free and the glaciating branch of the curve (see Fig. 3). These findings have profound implications.
The GHG forcing from the deepest recent ice age (LMG, 20 000 bp) to current interglacial warmth is ~3.5 W/m2. An additional 4 W/m2 forcing would carry the planet, at equilibrium, to the ice-free state. Thus equilibrium climate sensitivity to GHG change, including the surface albedo change as a slow feedback, is almost as large between today and an ice-free world as between today and the ice ages.
The global climate sensitivity of 3°C for doubled CO2 is a considerable understatement of expected equilibrium global warming. Additional warming, due to slow climate feedbacks including loss of ice and spread of flora over the vast high-latitude land area in the Northern Hemisphere, approximately doubles the (equilibrium) climate sensitivity.
Equilibrium climate sensitivity of 6°C for doubled CO2 is relevant to the present global warming due to human activities. Equilibrium climate response would not be reached in decades or even in a century, because surface warming is slowed by the inertia of the ocean and ice sheets. However, the history of the earth suggests that positive feedbacks, especially surface albedo changes, can spur rapid global warmings, including sea level rise as fast as several metres per century. Thus if we push the climate system sufficiently far into disequilibrium, positive climate feedbacks may set in motion dramatic climate change and climate impacts that cannot be controlled.
Human-made global climate forcings now prevail over natural forcings. Warming ‘in the pipeline’, mostly attributable to slow feedbacks, is now about 2°C (see Fig. 2). No additional forcing is required to raise global temperature to at least the level of the Pliocene, 2-3 million years ago, a degree of warming that would surely yield ‘dangerous’ climate impacts.
This raises the spectre of the ‘tipping point’ at which rapid changes proceed practically out of our control. Arctic sea ice and the West Antarctic Ice Sheet are examples of potential tipping points. Arctic sea ice loss is magnified by the positive feedback of increased absorption of sunlight as sea ice retreats.
Hansen and colleagues define the tipping level as the global climate forcing that, if long maintained, gives rise to a specific consequence, and the point of no return, a climate state beyond which the consequence is inevitable, even if climate forcings are reduced. A point of no return can be avoided, even if the tipping level is temporarily exceeded. Ocean and ice sheet inertia allow some overshoot, provided the climate forcing is returned below the tipping level before initiating irreversible dynamic change.
Points of no return are inherently difficult to define, because the dynamical problems are nonlinear. Existing models are more “lethargic” than the real world for phenomena now unfolding, including changes of sea ice, ice streams, ice shelves, and expansion of the subtropics.
The tipping level is easier. It is a measure of the long-term climate forcing that humanity must aim to stay beneath to avoid large climate impacts. The tipping level does not define the magnitude or period of tolerable overshoot. However, if overshoot is in place for centuries, the thermal perturbation will so penetrate the ocean that recovery becomes unlikely.
A CO2 level of 450 ppm or larger, if long maintained, would push the earth toward the ice-free state. Although ocean and ice sheet inertia limit the rate of climate change, such a CO2 level is like to cause the climate tipping point and initiate dynamic responses that could be out of control.
The climate system, because of its inertia, has not yet fully responded to the recent increase of human-made climate forcings. Yet climate impacts are already occurring that allow us to make an initial estimate for a target atmospheric CO2 level of 350 ppm.
A large fraction of fossil fuel CO2 emissions stays in the air a long time, one-quarter remaining airborne for several centuries. Thus moderate delay of fossil fuel use will not appreciably reduce long-term human-made climate change. What’s needed is for most remaining fossil fuel carbon to be never emitted to the atmosphere. Coal is the largest reservoir of conventional fossil fuels, exceeding combined reserves of oil and gas. The only realistic way to sharply curtail CO2 emissions is to phase out coal use, except where CO2 is captured and sequestered.
There are serious doubts about the economics, efficacy and safety of carbon capture and storage (CCS), which is still very much on the drawing board [6] (Carbon Capture and Storage A False Solution, SiS 39). Even if it were to work, the cost of coal power would go up so much relative to renewable that it would be priced out of the market.
Hansen and colleagues also suggest improved agricultural and forestry practices, reforestation, biochar, biofuels on degraded or marginal lands with associated biochar production.
We support improved agricultural and forestry practices as well as genuine reforestation with indigenous biodiverse tree species, as argued in [7] Food Futures Now: *Organic *Sustainable *Fossil Fuel Free (ISIS Report), where we presented evidence for the potential of organic agriculture and localised food and energy systems to mitigate more than 50 percent GHGs and energy use, updated in [8] Organic Agriculture and Localized Food & Energy Systems for Mitigating Climate Change (SiS 40).
But the evidence is damning against biofuels [8] and biochar [9] (Beware the Biochar Initiative, SiS 44), especially in light of recent finding that O2 is depleting from the atmosphere much faster than CO2 is rising [10] (O2 Dropping Faster than CO2 Rising, SiS 44). Fast-growing trees for biofuels, and worse, burying trees as biochar will severely compromise the earth’s ability to regenerate O2 creating extra oxygen sinks and carbon sources besides.
In a forthcoming report [11] Green Energies, we shall present the truly renewable and sustainable energy options that would bring us on target with 350 ppm without false solutions such as nuclear and CCS.
Article first published 09/09/2009
Comments are now closed for this article
There are 5 comments on this article.
Svempa Comment left 20th September 2009 16:04:48
This is nothing else but political propaganda with no science attached. There is absolutely no reason to worry about higher temperatures in the future due to anthropogenic CO2-emissions. It is true that a doubling of CO2 in the atmosphere theoretically could cause a global temperature increase of about 1 degree Celsius - but a doubling of CO2 is not possible. We do not have enough oil, gas and coal to achieve a doubling of CO2. And the assumption of positive feedbacks doubling or tripling this figure are pure fantasies - in reality the feedbacks are negative.
Furthermore, there are other climate effects that dominate over the increase in CO2 and which are causing a gradual cooling of the climate. This has already progressed over a number of years, but will continue over the next 20 years at least.
Dr Peter Lester Comment left 22nd September 2009 05:05:38
I would like to point out that animals, especially grazing ruminating cattle and sheep,are not responsible for high carbon outputs as they are being painted, these animals cannot and do not make carbon, they are natures most efficient recyclers. The carbon they are forced to recycle is a result of poor fertilizer practices. Don't blame the animal, blame MAN.
Sky McCain Comment left 23rd September 2009 18:06:27
I suggest that you do some research with Google. The following URL is a good start.
http://news.bbc.co.uk/go/pr/fr/-/1/hi/uk/6290228.stm
My research led me to believe that the amount of variance of irradiance due to sunspot activity is far, far too little to be considered a significant driver of global warming. The Little Ice Age, chosen by sunspot activists, was most probbly caused by a halting of the Atlantic Current due to rapid ice melt.
Citing a correlation between event A and event B with no rational scientific evidence to support a hypothesis is insufficient evidence to even suggest cause and effect. The solar argument follows a propogandist path and is part of the obvious climate change skeptic's irrational line.
There is sufficient evidence available to anyone through the web to allow anyone to find their own evidence and make their own conclusions.
For instance, most temperature and CO2 graphs clearly show a cooling trend (normal after an interglacial period) up until the 1900s. There are simply no orbital forcing drivers that can account for this upward temperature. We are past due for a significant downward temperature swing. All one needs to do is look at the ice core samples from the last 3 interglacial periods to see that the rising and then falling temperatures of an interglacial period has always been a spike and not a prolonged period. Yes, it may well be that the orbital forcing drivers cannot force a tipping toward rapidly decreasing temperatures. But we cannot just throw up our hands and blame natural factors when our CO2, methane and NO2 emissions are reinforcing this possible inability. One must be aware that global warming and climate changes are the result of very complex interactions of many positive and negative forcings. The close correlation of temperature and CO2 is beyond question. The fact that CO2 is higher than ever recorded over the last 3 glacial/interglacial periods is beyond dispute.
We simply will not ever have a 2 X 2 = 4 certainty over Gaia's behaviour. We don't have that over any being's behaviour. Gaia is not a machine with a speedometer. In the past interglacial periods, carbon was sequestered by millions upon millions of trees. Humans have destroyed Gaia's natural methods of cooling herself. We know enough to act toward limiting human produced GHG. We simply don't know enough about Gaia's behaviour to bet against her. Lack of certainty must not sway our efforts to act.
Judy Cross Comment left 28th September 2009 15:03:20
I just discovered i-sis' position on AGW/CC. It throws into doubt everything else I may have read here over the years when supposed scientists can't seem to understand that CO2 has no effect on climate.
What causes the climate to change is not the real issue. The real issue is whether CO2 does it.
In spite of the $79 Billion spent on climate studies, there is no evidence to support the hypothesis.
"The most telling point is that after spending $30 billion on pure science research no one is able to point to a single piece of empirical evidence that man-made carbon dioxide has a significant effect on the global climate.
If carbon is a minor player in the global climate as the lack of evidence suggests, the
“Climate Change Science Program” (CCSP), “Climate Change Technology Program” (CCTP), and some of the green incentives and tax breaks would have less, little, or no reason to exist. While forecasting the weather and climate is critical, and there are other good reasons to develop alternative energy sources—no one can argue that the thousands of players who received these billions of dollars have any real incentive to “announce” the discovery of the insignificance of carbon’s role."
http://joannenova.com.au/2009/07/massive-climate-funding-exposed/
Sharon Medway Comment left 15th September 2009 15:03:51
I am curious to know if there is any information on the solar flares and other ejections from the sun affecting the global warming.
In Science News, June 2009, there is a report that solar flare activity is quite low at this time and they anticipate even less activity within the next two years. In the past this lack of activity prompted the 'little ice age' and record low temperatures. I would like to know if there is any evidence that this would help cancel out the rising temperatures.