John Cook rebuts the most common sceptic arguments against global warming
A Gallup poll finds only 58 percent of the general public believe human activity is changing global temperatures [1] That is in strong contrast to 97 percent of actively publishingclimate scientists who say humans are a significant contributor [2]. Why the great divide between public opinion and scientific experts? Unfortunately, there is no shortage of misinformation and confusion surrounding the climate debate. How does one penetrate the noise to get real scientific evidence? When one scans the many arguments of global warming skeptics [3], a common pattern emerges. Each argument narrowly focuses on a small piece of the puzzle while ignoring the broader picture. This form of cherry picking often leads to erroneous conclusions.
A typical example is the sceptic argument [4] "Human CO2 emissions are small compared to natural emissions". The argument is as follows: “Land and vegetation emit 439 Gt of CO2 each year while oceans release 332 Gt. In contrast, humans emit only 29 Gt of CO2 a year. How can humans make an impact on climate when our CO2 emissions are so tiny compared to natural emissions?”
While these numbers are correct, they don’t tell the full story. This argument fails to disclose that nature both emits and absorbs carbon dioxide. Land and vegetation make up a strong carbon sink, absorbing 450 Gt per year. Similarly, the ocean absorbs around 338 Gt per year. As a result, the net natural contribution is less than zero (see Figure 1).
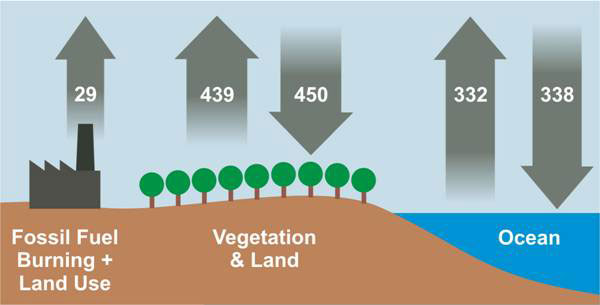
Figure 1 Global carbon cycle
Numbers represent flux of carbon dioxide in gigatonnes [5]
Is it arrogant to presume mere humans could possibly influence the immense, uncontrollable forces of nature? It's not a question of arrogance. It's simply a question of numbers. Humans are emitting29 Gt CO2 a year [6]; slightly less than half of that is absorbed by the natural carbon sinks, so CO2 in the atmosphere is increasing by 15 Gt per year [7]. Our activities in burning fossil fuels and changing land use have upset the natural balance. The recent rate of increase since the industrial revolution is unprecedented (see Fig. 2). Furthermore, atmospheric CO2 is at its highest level in 15 to 20 million years, as documented most recently in ice core data [8].
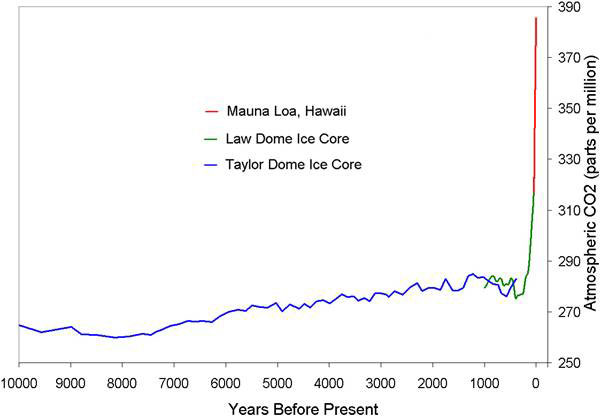
Figure 2 CO2 levels (parts per million) over the past 10 000 years
Blue line derived from ice cores obtained at Taylor Dome, Antarctica [9]; green linederived from ice cores obtained at Law Dome, East Antarctica [10]; red line from direct measurements at Mauna Loa, Hawaii [11]
How do we know rising CO2 levels actually cause warming? Sceptics often claim there’s no empirical evidence that humans cause warming [12]. But the evidence is there in the peer reviewed literature, if they had bothered to look. If CO2 is causing a greenhouse effect, we expect to see less infrared radiation escaping out to space at the wavelengths that CO2 absorbs energy.
In 1970, NASA launched the IRIS satellite measuring infrared spectra. In 1996, the Japanese Space Agency launched the IMG satellite which recorded similar observations. Both sets of data were compared to discern any changes in outgoing radiation over the 26 year period [13]. What they found was a drop in outgoing radiation at the wavelength bands that greenhouse gases such as CO2 and methane (CH4) absorb energy (see Fig. 3). Thusthe paper found "direct experimental evidence for a significant increase in the Earth's greenhouse effect". This result has been confirmed using data from later satellites [14, 15].
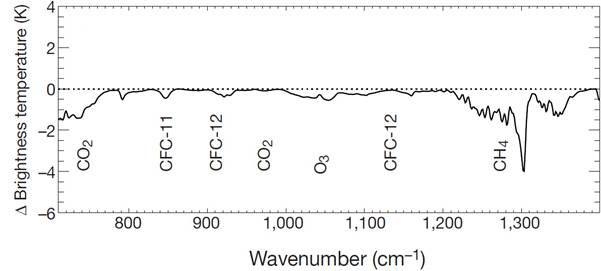
Figure 3 Change in outgoing radiation spectrum from 1970 to 1996 due to trace gases
'Brightness temperature' indicates equivalent blackbody temperature [13].
When greenhouse gases absorb infrared radiation, the energy heats the atmosphere which in turn re-radiates infrared radiation in all directions. Some makes its way back to the earth's surface. Hence we expect to find more infrared radiation heading downwards. Surface measurements from 1973 to 2008 found an increasing trend ofinfrared radiation returning to earth [16]. A regional studyover the central Alpsfound that downward infrared radiation is increasing due to the enhanced greenhouse effect [17]. Taking thisa step further, an analysis of high resolution spectral data allowed scientists to quantitatively attribute the increase in downward radiation to each of several greenhouse gases (see Fig. 4). The downward flux due to CO2 alone (by far the biggest of all the gases in Fig. 4) was 26 W m-2. The resultsled the authorsto conclude that [18] "this experimental data should effectively end the argument by skeptics that no experimental evidence exists for the connection between greenhouse gas increases in the atmosphere and global warming."
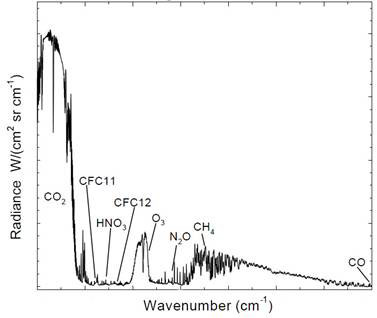
Figure 4 Spectrum of the greenhouse radiation measured at the surface. Greenhouse effect from water vapour is filtered out, showing the contributions of other greenhouse gases [18].
An enhanced greenhouse effect is being observed [19]. The planet is accumulating heat due to increasing greenhouse gases. This is the gorilla in the room for those searching for other causes of global warming – how do you account for all the extra heat trapped by CO2?
The most common sceptic’s approach is to simply ignore the CO2 effect and focus on other potential causes, the most popular alternative being the sun. After all, the sun supplies almost all of our climate’s energy. This is the major theme of Martin Durkin’s film “The Great Global Warming Swindle” which uses a strong correlation between solar activity and temperature to supposedly prove the sun is the cause of global warming [20]. The graph comparing sun to climate shown in the film stopped mysteriously around 1980. That’s probably because, unfortunately for the theory, any correlation between sun and temperature ends around 1975. At this point, the global climate warmed while solar activity showed a cooling trend. Over the last 35 years while temperatures have been rising, the sun has been going in the opposite direction (see Fig. 5).
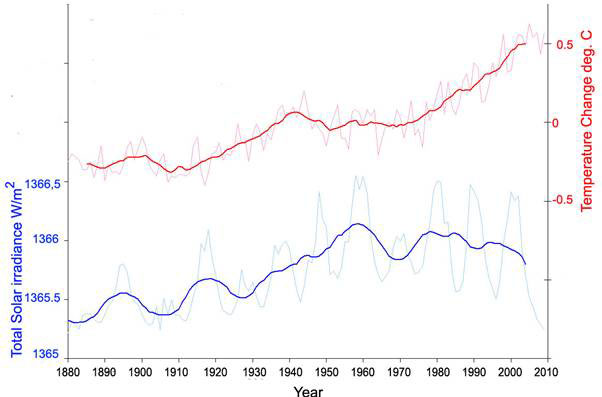
Figure 5 Annual global temperature change (thin light blue) with 11 year moving average of temperature (thick dark blue) [21].Annual total solar irradiance (TSI) (thin light red) with 11 year moving average of TSI (thick dark red). TSI from 1880 to 1978 reconstructed from sunspot numbers [22]. TSI from 1979 to 2009 from satellites [23].
It’s easy to focus on small pieces of the puzzle when those pieces happen to be the regions we inhabit. The cold spell that swept across Eurasia, England and parts of North America through December 2009 and early January 2010 led to many to claim global warming has ended [24]. To gain a proper perspective of this anomalous weather, we need tostep back and look at the broader picture such as a temperature map of all regions north of 30°N (Fig. 6).
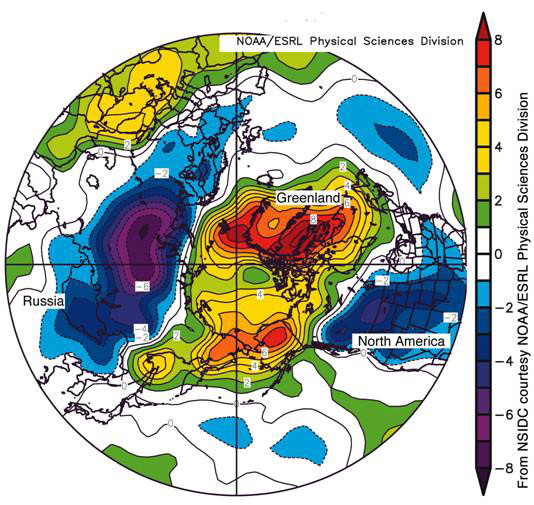
Figure 6 Map of temperature anomaly for December 2009 at roughly 1000 metres altitude for the region north of 30°N. Areas in orange and red correspond to strong warm anomalies. Areas in blue and purple correspond to cool anomalies (courtesy of National Snow and Ice Data Center (courtesy NOAA/ESRL Physical Sciences Division [25])
While Eurasia and North America are experiencing unusually cold weather, other regions such as Greenland, eastern Siberiaand the Arctic Ocean are experiencing strong warmth. The hottest regions (more than 7 ˚C above average) are over the Atlantic side of the Arctic, including Baffin Bay and Davis Strait. Unsurprisingly, sea ice extent was below average in this region.
These strong contrasts in temperature are the result of a strongly negative phase of the Arctic Oscillation, caused by opposing patterns of atmospheric pressure between the polar regions and mid-latitudes. Duringa negative phase, pressures are higher than normal over the Arctic and lower than normal in mid-latitudes.In December 2009, the Arctic Oscillation index was the most negative value since at least 1950.
An even broader picture is a global map of temperature anomaly in the last week of December 2009. Here we see that much of the planet is experiencing warmer temperatures than usual, including North-east America, Canada, North Africa, the Mediterranean, and south-west Asia (Fig. 7).
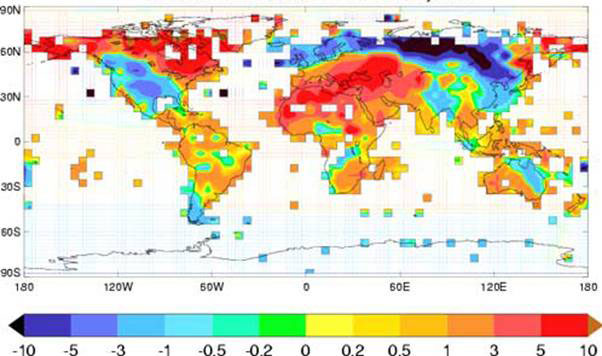
Figure 7 Map of global temperature anomalies, December 26 to January 1 [25]
Even surface temperature doesn’t give you the full picture of global warming. The land and atmosphereare a small fraction of the Earth's climate.The vast majority of heat build-up from global warming goes into the oceans. When all the heat accumulating in the oceans, atmosphere and energy required to melt ice sheets and sea ice are tallied up, we find the planet has accumulated 210 x 1021J over the past 35 years (Fig. 8). This is an average rate of 190 260 GW [27]. Considering a typical nuclear power plant has an output of 1 GW, imagine 190 000 nuclear power plants pouring their energy output directly into our oceans.
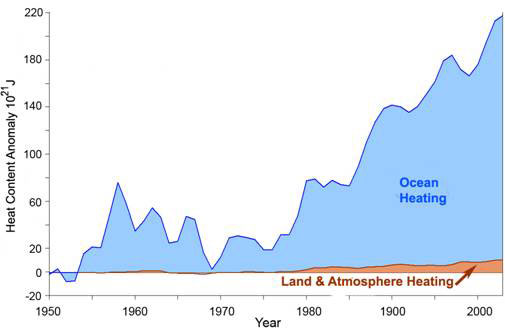
Figure 8 Total Earth Heat Content from 1950. The energy to melt ice sheets and sea ice is included in the Land + Atmosphere portion [27]
John Cook studied physics at the University of Queensland, Australia, and majored in solar physics in his post-grad honours year. He runs the Skeptical Science website www.skepticalscience.com, SiS Editors’ top choice for climate change
Article first published 25/01/10
Comments are now closed for this article
There are 11 comments on this article.
Leenknegt Donald Comment left 29th January 2010 20:08:16
Every day it becomes clearer that there has been a systematic manipulation of the temperature data in many ways, so that the reports of the IPCC are losing day by day all there credibility. Every check of the data proves that the whole global warming thing is based on fraud and has very little truth left. Just read one (there are lots more) of the extensive latest reports that cannot be ignored:
http://scienceandpublicpolicy.org/images/stories/papers/originals/surface_temp.pdf
How can you build good science on faked data?
The gobal warming hoax is now dying a little bit every day. And that is a very sad thing, because many, many people who really wanted to do something for the ecology of this earth will be disillusioned in the coming months and years. The responsibility of a clan of scientists(??) who concocted this fraud over the years is shattering.
Please open your eyes and start seeing what really is happening through politics, media, greed and organisations with obscure agenda's..
Use common sense, like lots of simple people and understand that it simply does not fit..
Rory Short Comment left 9th February 2010 03:03:03
I am not a climatologist. I was born in Johannesburg South Africa in 1939. I have basically lived here all my life, except for two spells in the UK totalling eleven years. I know that the heat I experience from the sun on a normal cloudless day is now much greater, than when I was a child and a young adult, and yet astronomers tell me that the sun is going through a period of cooling! Global warming is happening.
Natural Causes Of Global Warming Comment left 9th February 2010 01:01:16
So ok, there is no global warming. So what happens to all the pollution from the factories and vehicles? Absorbed by trees and turn into apples?
ant Comment left 29th January 2010 20:08:25
I'd like to see the graphs that accompany this... they are not present now. Some of the arguments seem kind of weak. No where did they touch on the minute fraction of the atmosphere that is actually CO2 (less than 4/100 of a percent... that's around .038 percent). The top 5 components have much stronger heat capacities... the mass of the atmosphere compared to the mass of the land and seas is negligible... the placement of US temperature stations is less than satisfactory: http://surfacestations.org/
People who want to believe in AGW are often self-immolating neo-hippies... I trust nothing out of that bitch-assed society of British Devils either
Kevin Moore Comment left 26th January 2010 09:09:23
Just being a person with a bit of nous, I would have to see Christopher Moncktons views on this article before I pass judgement.
ehnriko Comment left 26th January 2010 20:08:06
The villains' signature: Twist the truth, say Half Truth, invent a truth, give half of the picture by using actual data, but mix it with small lies.
Law of polarity says... a whole line of positives becomes negative in output when even one fraction of a negative charge is introduced into the equation.
It has nothing to do with the volume or potential..
Man should be more wise nowadays and exercise their own freewill to think, digest, analyze and comprehend anything which is presented to them.
There are only 3 types of people... Those who see, those who see what is presented to them... and those who cannot see.
They can invent whatever they want but for those who are enlightened and highly evolved minds... no lies can suffice the real truth.
The Truth is... there is already an ecological imbalance... which began during the industrial revolution.
Take time to research how much fossil fuel is being burned around the world every day.
sawitri Comment left 26th January 2010 20:08:14
it is very hard to encourage people to reduce co2.
because they don't care what will happen to this planet earth.
Fergus Mclean Comment left 10th April 2010 14:02:40
How do you account for the lack of warming between 1940 and 1980?
Current ice data indicate arctic ice near the 1975-1998 average for this date. What other melting goes into your ocean energy calculation?
Thanks for the civil dialogue.
John Cook Comment left 11th April 2010 00:12:42
Fergus, the cooling period in the mid-20th century was largely due to an increase in pollution that led to more aerosols (suspended particles in the air) that reflect sunlight. This same cooling effect is observed when large volcanic eruptions spew sulfate aerosols into the stratosphere, temporarily lowering global temperatures. However, when clean air laws cleared up the pollution, the CO2 warming overpowered the diminishing aerosol cooling and global warming resumed. Interestingly, a number of peer-reviewed papers in the 1970s predicted global warming due to increasing CO2 even during this cooling period.
The Arctic ice data you're refering to is sea ice extent. This refers to the area that sea ice covers but does not factor in the total volume of sea ice in the Arctic. What we're observing is the thicker, multi-year ice has been diminishing steadily. So while sea ice extent shows more variability from year to year, dependent on how much first-year ice forms in the winter and how weather conditions push the sea ice around, the long-term trend is that the Arctic is steadily losing ice from year to year.
Steve Fowkes Comment left 15th August 2014 21:09:12
I've seen biased manipulation of data in climate prediction starting in the 70s, so I fully appreciate Leenknect's doubts, and share them. Fraud is rampant in science. My field is nutrition, metabolism, and neurodegenerative diseases, not climatology. I've seen countless examples of utter fraud developing into popular belief and even scientific adoption. 1) Cherry picking countries to arrive at the conclusion that saturated fat causes cardiovascular disease. 2) Obesity is a character flaw involving gluttony and sloth. 3) Selegiline causes increased morality. 4) Heart disease is caused by cholesterol. 5) Obesity is the risk factor, not insulin resistance. 6) Alzheimer's disease is type-III diabetes. 7) Alzheimer's disease is caused by herpes. Scientists regularly get it wrong. John Cook, one missing element in your article; please address the ice core data which shows that, in the past, global warming events have all preceded (not followed) carbon dioxide increases, which suggests that this may be just one more example of scientists getting the causal arrow reversed. Thank you.
Steve Fowkes Comment left 15th August 2014 21:09:20
John, you ask why the discrepancy between popular beliefs and scientific beliefs re human cause of global warming. If you look at Science (note the cap-S) as a religion, the question might not need to be asked. Why do Catholics believe in original sin more than non-Catholics? Why do Christians believe that Jesus is their savior more than Hindus or Budhists? The question is ideological / theological. Historically, the majority of scientists believed that the world was flat. Historically, the majority of surgeons in Europe believed that washing hands was utterly unnecessary. Currently, most US doctors believe that lowering cholesterol with statins improves health outcomes. The social conditioning of any group plays a role in 1) the adoption of casually accepted beliefs, and 2) speaking out against errors of beliefs. In the past, experts were paid to prove the divine right of kings. Today, scientists are paid to prove human-mediated climate change. Nut in reality, the "proof" is just a claim. So climate change from non-human cause is today's heresy. Rather than being truly noteworthy, your question merely points out institutional bias in science (especially in Science). And this is not limited to climatology. Evolution is just as good of an example. And the natural resistance of non-members to the beliefs of members of a sect is pretty much expected.