Physics of Organisms & Applications
You can tell a person’s health from the way the heart beats, it is the complex rhythm of the Quantum Jazz of life, and mathematical physicists are learning how to decipher it. Dr. Mae-Wan Ho
As regular as heartbeat, right? Not exactly, scientists with a physical bent and penchant for number crunching have been busy analysing the heartbeat for the past 20 years. They talk about the ‘complexity of the heartbeat’ and how best to wrest signs of dynamic order out of apparently random variability, which, they are convinced, could tell doctors whether the person is healthy or not [1].
The apparent regularity of the heartbeat conceals abundant variability, and contrary to common intuition, the more healthy the heart, the more variable the beat (Fig. 1), and this can be seen by recording how the interval between successive heartbeats changes (see Box 1).
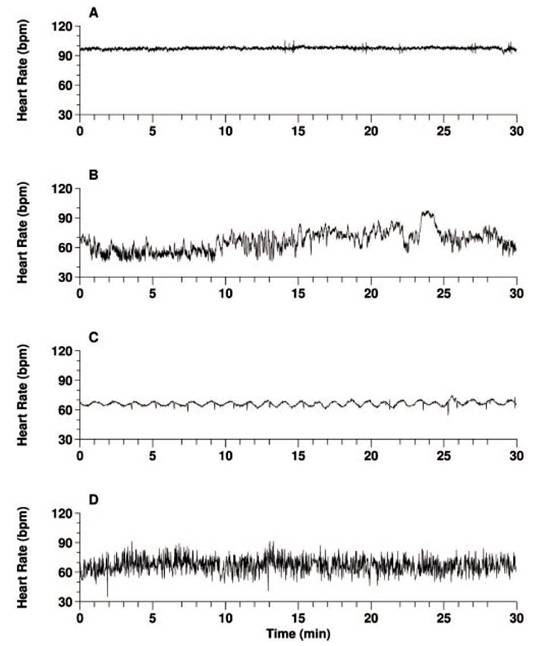
Figure 1. Which is the heartbeat of health?(Modified from [2])
Figure 1 [2] contains four heartbeat recordings, only one of which is from a healthy individual, the other three are from people with severe heart disease. A and C, which look quite regular, are from patients with severe congestive heart failure, while D is from a subject with fibrillation of the atrium (see Box 1), which produces a very erratic heartbeat. B is the record of the healthy heart, which looks far from regular.
The most exciting discovery about the healthy heartbeat is the rich mathematical structure underlying the apparent variability that distinguishes it from arbitrary randomness; in much the way that music can be distinguished from noise.
The healthy heart beats to the complex rhythm of Quantum Jazz [3] (SiS 32), “the music of the organism dancing life into being” (see also Quantum Jazz, The Tao of Biology [4], SiS 34).
The heart has four chambers: two upper small ones called left and right atrium and two lower big ones called left and right ventricle. A ‘pacemaker’ site, the sinoatrial (SA) node located in the back wall of the right atrium, initiates the heartbeat. Special cells in the SA node spontaneously generate spikes of electrical discharge (action potentials) at a rate of about 100 per minute. This intrinsic rhythm is strongly influenced by the autonomic (involuntary) nerves. The vagus (parasympathetic) nerve brings the resting heart rate down to 60-80 beats/min, the sympathetic nerves speeds up the heart rate.
The action potential generated by the SA node spreads throughout the upper heart chambers (atria), depolarising them and causing them to contract. The electrical impulse meanwhile travels to the lower chambers (ventricles) via the atrioventricular (AV) node in the wall between the atria, where specialised conduction pathways rapidly conduct the wave of depolarisation throughout the ventricles to make them contract. It is very important for the depolarisation wave to travel unimpeded and intact through the heart so that the contraction of the heart chambers are coordinated to send blood efficiently to the lungs and through to the rest of body. ‘Fibrillation’ of the heart occurs when the depolarisation wave breaks up, and different parts of the heart contract in a totally disorganised way, which can cause death if untreated immediately.
The giant electric fields generated by the depolarisation and contraction of the atria, followed by the ventricles are detected throughout the body, and can be recorded with electrodes placed on the chest and the wrists and ankles. A continuous record of successive heartbeats obtained in this way is referred to as the electrocardiogram (ECG). It can be seen that the contraction of the ventricle sends out the most prominent spike, and beat-to-beat interval (interval between two heartbeats) is taken between these big spikes. Some instruments can record these beat-to-beat intervals directly to form a continuous record (see Fig. 1). It turns out that how the beat-to-beat interval changes with time may tell us whether the individual is healthy.
In 1993, Eugene Stanley and collaborators at Boston University in the United States published a paper showing that while the heartbeat records from healthy people look superficially very variable, there is a long-time correlation in the intervals between beats in the healthy heart [7]. For example, shorter intervals tend to be followed by longer ones, and the effect occurs on a wide range of time scales, from seconds to many hours. In contrast, heartbeat records from heart disease patients look superficially much more regular, but were significantly less correlated when analysed mathematically. In other words, there was less dynamic order in the heart rhythm of those afflicted with heart disease.
There have been numerous studies aimed at extracting the mathematical structures that characterize the rhythm of the healthy heartbeat, in order to clearly distinguish it from the heart rhythms of people with heart disease or at risk from heart disease [8]. That is important not only for diagnosis, but also for monitoring the patient’s recovery and response to various drugs and treatments. And mathematics can help to accomplish this non-invasively, with minimum intervention and risks. It is a bit like the practitioner of traditional Chinese medicine who can diagnose illnesses of the internal organs by feeling the quality of the patient’s pulse.
According to the American Heart Association, 79.4 million American adults (1 in 3) are estimated have one or more types of cardiovascular disease, of which 37.5 million are aged 65 or older [9]. Among them are overlapping categories of 72 million with high blood pressure, 15.8 million with coronary heart disease, 7.9 million with myocardial infarction (heart attack) and 8.9 million with chest pains. Cardiovascular disease claims more lives each year than cancer, chronic lower respiratory disease, accidents and diabetes mellitus combined. More importantly, millions suffer from undiagnosed heart disease; the prevalence of undiagnosed congestive heart failure is estimated to be approximately 20 million in the US [8].
Although there are some conventional tests for the diagnosis of heart disease (several of them highly invasive), none can effectively predict which patients are at risk of sudden death. New drugs and other treatments continue to be developed to treat heart disease, but there are still no tests that can rapidly evaluate how well the patient is responding to treatment, and whether the risk of sudden death has been reduced or increased by the treatment. Consequently, the efficacy of these treatments must be determined empirically with slow, prospective-controlled studies that last for many years, and even then are very difficult to extrapolate to individual patients.
The study of heart rhythm was considered so important that the European Society of Cardiology and the North American Society of Pacing and Electrophysiology formed a task force to develop the standards of measurement, physiological interpretation and clinical use of heart rate variability. The task force published their findings in 1996 [10]. In September 1999, under the sponsorship of the National Center for Research Resources of the National Institutes of Health, Ary Goldberge and colleagues at Harvard Medical School in Boston, USA inaugurated the Research Resource for Complex Physiologic Signals available at http://circ.ahajournals.org/cgi/content/full/101/23/e215 [2, 11]. The PhysioNet Resource, as it came to be known, has three interdependent components. The PhysioBank is a large and growing archive of well-characterized digital recordings of physiologic signals from healthy subjects and from those with a variety of conditions such as life-threatening cardiac arrhythmias, congestive heart failure, sleep apnea (cessation of breathing during sleep), neurological disorders and aging. PhysioToolkit is a library of open-source software for physiological signal processing and analysis, detection of significant events by using both classical techniques, and novel methods based on statistical physics and non-linear dynamics. PhysioNet is an on-line forum for dissemination and exchange of recorded biomedical signals and open-source software for analysing them.
The typical heart rhythm data are time series of the interval between successive heartbeats lasting from minutes to 24 hours. The length of the interbeat interval changes from one interval to the next, fluctuating around a mean of about a second (60 beats per minute). It conforms to the mathematical structure of ‘deterministic chaos’ in that the interbeat interval, though locally unpredictable, is nevertheless globally confined in its variation within a ‘strange attractor’ in abstract mathematical ‘phase space’. That was not surprising, as the same mathematical structures have been found in many natural and biological processes [12] (The Excluded Biology, SiS 18). By applying more and more sophisticated mathematical tools for signal processing, researchers have been able to characterize the healthy heart rhythm quite precisely [2, 8-11, 13-16].
A method widely used to analyse a signal or time series is to estimate its power spectrum density - the signal’s relative frequency content - assuming that the signal is made up of waves of different frequencies. This is done by a Fourier Transform, which gives a spectrum of many frequency peaks, the higher the amplitude of the peak the more that frequency component contributes to the signal.
The healthy heart rhythm typically shows that the contributions of different frequencies S(f) varies as the reciprocal of the frequency 1/f, i.e.,
S(f) ~ f -b (1)
Plotting log S(f) against the log f will give a straight line with a slope of -b, and this is referred to as 1/f scaling, characteristic of processes that exhibit fractal dynamics.
Fractals are irregular objects that have fractional dimensions in between the usual 1, 2, or 3, and display ‘self-similarity’, in that they are made of subunits (and sub-units of subunits many times over) that resemble the structure of the whole at many different scales of magnification. Examples are branching trees, fern leaves, and blood vessels.
Fractals describe not just geometric objects, but especially complex biological processes that are correlated with one another.
For example, metabolic rate B increases as body mass M increases according to the ‘allometric’ relationship, B ~ Ma, which has been known to apply famously across animal species from mouse to elephants since 1932, but no one had a satisfactory explanation until Geoffrey West from Los Alamos National Laboratory and James Brown at the University of New Mexico, Albuquerque and colleagues showed how allometric scaling arises from fractal structures [17] (No System in Systems Biology, Biology’s Theory of Everything, SiS 21), and indeed, implies fractals self-similarity [10].
Fractal mathematics has been applied successfully to signals such as the healthy heartbeat that fluctuates across multiple time scales in similar ways. Typically, the larger the time scale the bigger the fluctuation; and when the logarithm of the fluctuation F(n) is plotted against the logarithm of the time scale (in number of heartbeats) n, a straight line is obtained with slope a, as indicative of scaling, or self-similarity:
F(n) ~ na (2)
For this analysis, the time series is first ‘detrended’ to remove the underlying local trend, i.e., it is smoothed to obtain a flat baseline for all times, before computing the amplitude of fluctuations over different numbers of heartbeats, from 2 to 10 000.
Applying the method to 30 datasets - each a 24 h record – from 18 healthy and 12 patients with congestive heart failure, the Boston University and Harvard Medical School researchers found that the data during wake hours scale linearly over two decades between 60 to 6 000 beat, with the average exponent aw~1.05 for the healthy group, and 1.2 for the heart failure patients [11, 15]. For the sleep data, a smaller average exponent as ~ 0.85 was found for the healthy and 0.95 for the heart failure group. When the data points of the time series were shuffled (to destroy the intrinsic dynamic order), they all gave a slope of 1.5 as characteristic of random walk fluctuations or Brownian motion, which has no long-term correlation.
The researchers also analysed 17 datasets from six cosmonauts during long-term orbital flight on the Mir space station under zero gravity and high stress activity. Each dataset contained continuous records of 6h under both sleep and wake conditions. For all cosmonauts, the scaling exponents were nearly the same as those found for the healthy terrestrial group: aw~1.04 for the wake phase and as~0.82 for the sleep phase. The individual record of a subject from each group is illustrated in Figure 2.
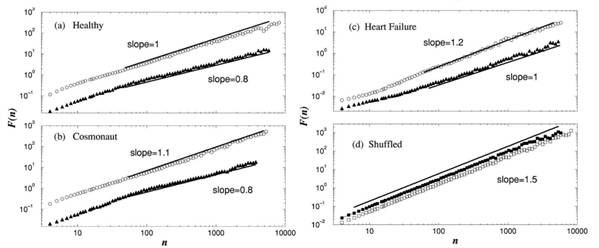
Figure 2. Plots of fluctuation against number of heartbeats (a) a healthy individual, (b) a cosmonaut, (c) a patient with heart failure, and (d) a randomised (shuffled) time series of the healthy individual. (Modified from [15].)
There are many scaling exponents on the heartbeat data capable of distinguishing between health and disease, and the scaling properties also vary with age, but the changes are different from those associated with heart failure.
The self-similarity of the healthy heart rhythm can be demonstrated most clearly with a mathematical procedure called ‘wavelet transform’, which estimates the differing spectrum of frequencies contributing to the changing signal at different time scales (see Fig. 3). The horizontal axis is time corresponding to about 1 700 heartbeats. The vertical axis is the scale of analysis increasing from 5 to about 300 s. The brighter colours indicate larger values of the wavelet amplitudes, corresponding to large heartbeat fluctuations. The white tracks represent the maximum wavelet transform lines, which exhibit a tree-like self-similar structure. So magnifying a portion of the upper panel corresponding to 200 beats on the horizontal axis and about 5 to 75 s on the vertical axis results in a structure (middle panel) resembling the whole. In contrast, the wavelet analysis of the times series from a patient with sleep apnea over 1 500 heart beats and 5 to 200 s (bottom panel) shows the loss of the self-similar structure over multiple timescales exhibited by the healthy heart (top panel).
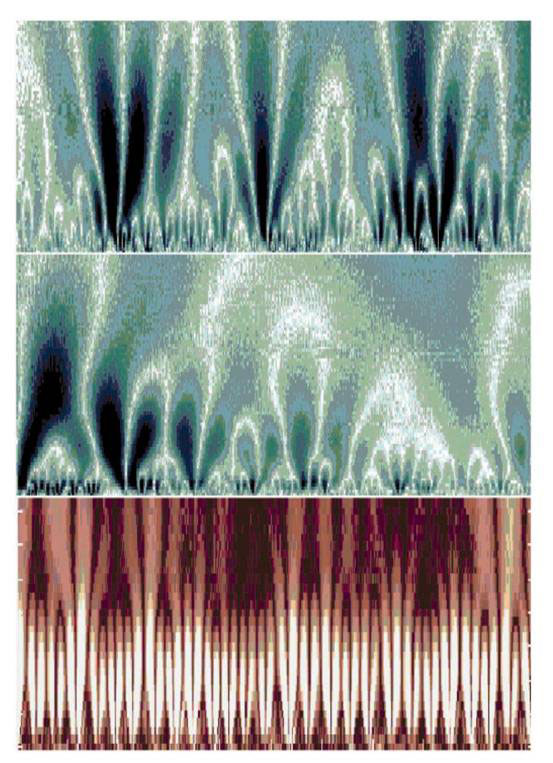
Figure 3. Wavelet analysis of heartbeat times series from a healthy subject (top and middle panel) and a patient with sleep apnea (bottom panel). See main text for details (modified from [11]).
The analyses of heartbeat time series described so far assumes that the signal is stationary, i.e., it remains the same over time. But it is clear from casual inspection of the time series (Fig. 1B) that the heartbeat signal is not stationary, and hence, the scaling exponents may differ at different times. In other words, the heart rhythm may be multifractal [13], rather than monofractal, and requires many exponents to fully characterize it.
Furthermore, the multifractal exponents of the healthy heart rhythm, h, are not independent of one another. The heartbeat series of 18 healthy subjects (both daytime and night-time) individually and as a group yielded multifractal exponents with fractal dimensions close to 1.0 distributed continuously over a broad range 0<h<0.3 centred at h~0.125 (Figure 4, black curve), suggesting that the fluctuations in the heartbeat exhibits anticorrelated behaviour (0<h<0.5 corresponds to anticorrelated behaviour; h=0.5 corresponds to uncorrelated behaviour, while h>0.5 correspond to correlated behaviour). In contrast, the time series from patients with congestive heart failure showed a clear loss of multifractality (Fig. 4, grey curve), with the exponents distributed over a much narrower range centred at h~0.22 (closer to 0.5 compared to the healthy heartbeat).
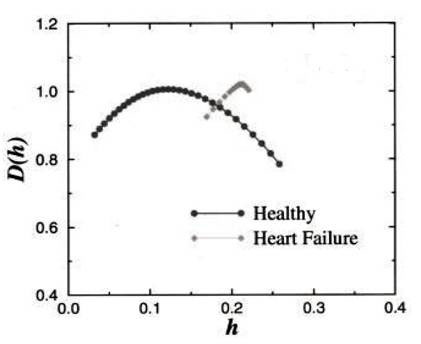
Figure 4. Fractal dimension versus multifractal (Hurst) exponent for the heartbeat records of healthy subjects compared with those of patients with congestive heart failure (see main text).
The significance of these findings is best described by the comment of the researchers [15] that the healthy heartbeat is “more like a symphony than a solo performance.”
The heart is not a solo player in the quantum jazz of life [3, 4]. Instead, it is in symphony with all other players, intermeshing and syncopating with their varied rhythms, reflecting the correlations and couplings in a system that is quantum coherent in the ideal. It is the rhythm of the organism dancing life into being, in which every single player is freely improvising and yet keeping in tune and in step with the whole.
The coupling between heart and other rhythms is quite precise, extending to phase correlations among all the body rhythms, which is why shuffling the heartbeat time series results in the loss of the exquisite hidden dynamic order that includes precise phase correlations. An unhealthy heart, by contrast, is no longer intercommunicating, but falls back onto its own intrinsic rhythm, like a very boring person who keeps saying the same things, not listening or responding to anyone else, which is why its heartbeat appears superficially more regular, while the dynamic hidden order is destroyed.
The study of heart rate variability looks so promising that patents have been granted recently on mathematical procedures for [7] “diagnosing heart disease, predicting sudden death, and analysing treatment response.”
Looking further ahead, this minimally invasive/intervention approach may be just the paradigm change we need in medicine to deliver health to the nation safely and effectively, based on an intellectually rigorous holistic perspective that’s nevertheless centred on the individual organism. Read the next article in the series Happiness is a Heartbeat Away [18] (SiS 35).
Article first published 25/07/07
Comments are now closed for this article