Not only is O2 dropping faster than CO2 rising, it is diving towards the danger point much faster than previously thought, O2 accounting is urgently needed Dr Mae-Wan Ho
In [1] O2 Dropping Faster than CO2 Rising (SiS 44), I highlighted new research showing the depletion of atmospheric oxygen accelerating since 2003, which coincided with the biofuels boom, and warned that climate policies focusing exclusively on carbon sequestration could be disastrous for all oxygen-breathing organisms including humans. I also call for O2 accounting in climate policies. The article attracted many comments not all favourable (see https://www.i-sis.org.uk/O2DroppingFasterThanCO2Rising.php).
Now, six years later, a detailed analysis of the atmospheric O2 records in 9 stations around the world shows that O2 is not just falling faster than CO2 is increasing, it is actually dropping more than 10 times faster than previously thought [2]. If it continues at this rate, the danger point will be reached in thousands of years or less, instead of tens of thousands of years.
One should bear in mind that although the proportion of O2 in the atmosphere is about 21 %, much, much higher than CO2 (currently ~0.4 %), the dangerous level of oxygen according to the US Occupational Safety and Administration and the US National Institute for Occupational Safety and Health is 19.5 %. In humans, failure of oxygen energy metabolism is the single most important risk factor for chronic diseases including cancer and death (see [1]).
The new analysis [2] has been carried out by Valeri Livinia and colleagues at National Physical Laboratory, Teddington, and John Innes Centre, Norwich in the UK. They used datasets on atmospheric O2 levels collected by the Scripps Institution of Oceanography at La Jolla, California in 9 stations around the world (see Figure 1) [3] under the direction of Prof Ralph Keeling, who pioneered the measurement techniques in his Ph D thesis at Harvard University in 1988 [4]. Records since 1989 are available from Scripps Pier and Alert in Alaska, although these are not continuous [5]. Continuous records from 7 stations extend back to 1993, and data for the remaining two, Cold Bay in Alaska and Palmer Station in Antarctica, are available back to the mid-1990s. Oxygen levels are measured as changes in the ratio of oxygen to nitrogen O2/N2 of sampled air relative to a reference sample of air pumped in the mid-1980s and stored in the Scripps laboratory. The unit is ‘per meg’ such that a decline of 1 per meg is equal to 1 part per million of oxygen or 0.0001 %; or 1 molecule of oxygen per 4.8 molecules of all gases in the atmosphere, not counting water vapour [5].
The Scripps O2 datasets also have variable timescales, with an average time interval of two weeks. Their length varies from 391 data points (Cold Bay) to 688 (Mauna Loa). For the analysis, all series were interpolated to obtain 4096 data power points separated by equal time periods.
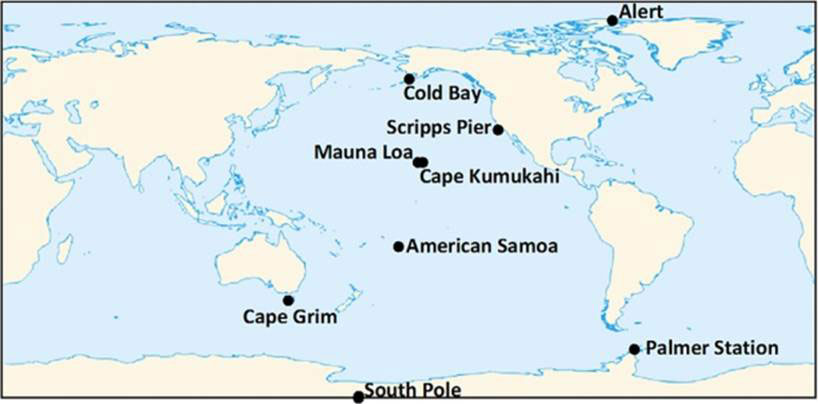
Figure 1 Nine Scripps stations measuring changes in atmospheric O2 around the world
The data from the nine stations are displayed in Figure 2, where the downward trend is obvious in all the datasets; some looking faster than linear.
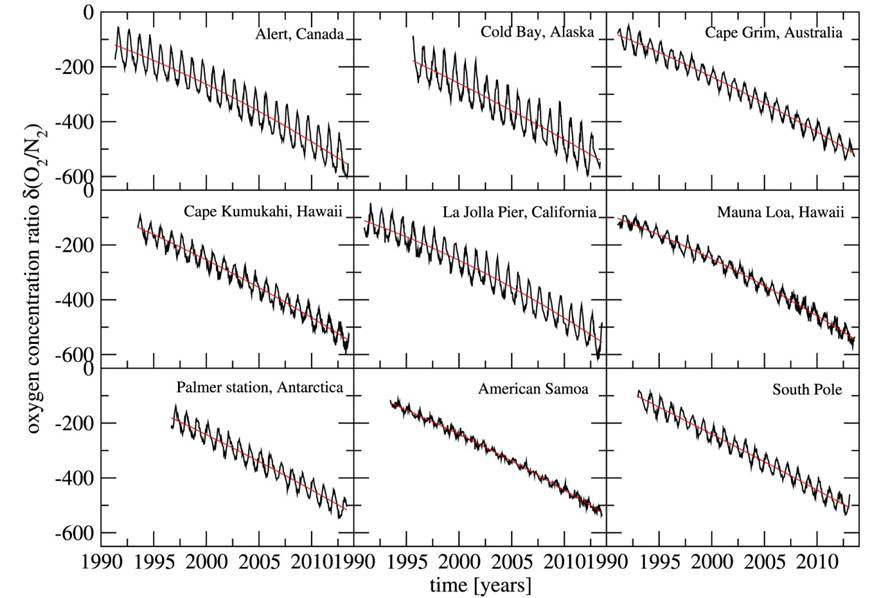
Figure 2 Downward trend of O2 concentration in all nine datasets
Livinia and colleagues applied Bayesian inference to the O2 concentration records, and confirm that they are all dropping at least quadratically (second order polynomial) rather than linearly (first order). Bayesian inference avoids the danger of over-fitting by automatically penalising model complexity. The Bayesian Information Criterion (BIC) is a criterion for model selection, the one with the lowest BIC value being preferred.
They tested several types of polynomial models (orders from 1 to 4, including the linear Ax +B and parabolic Ax2 + Bx + C), logarithmic A + Blogx and exponential –expAx +B, using BIC, Akaike Information Criterion AIC and Akaike corrected AICs for model selection. The results plotted in Figure 3 show that both linear and exponential models have the highest Information Criterion values, and are discarded in favour of polynomial models, for which the quadratic is taken as the most feasible (and most conservative) selection.
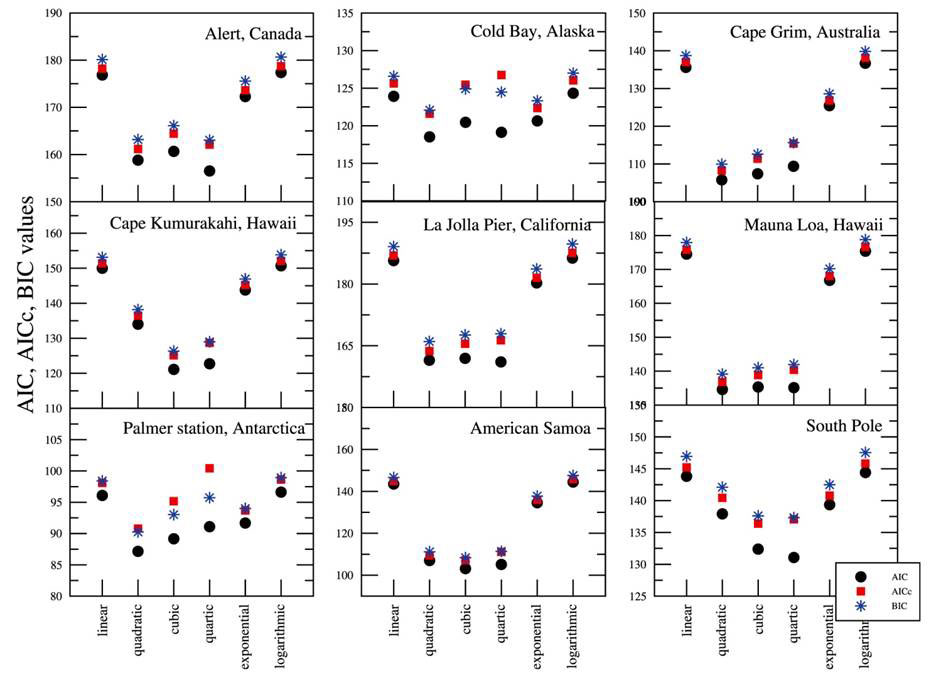
Figure 3 Plots of Information Criteria for model selection in all datasets
The average over the results of all nine oxygen records assuming quadratic (parabolic) decline is displayed in Figure 4. As can be seen, 100 % depletion of atmospheric O2 is projected to occur after 4 000 years. But the danger point, as far as humans are concerned, is a depletion of ~10 %, at <2 750 years; bearing in mind that this is a conservative estimate based on the analysis of available datasets. And it does not take into account the increase in population, fossil fuel consumption and other technological processes that create new oxygen sinks.
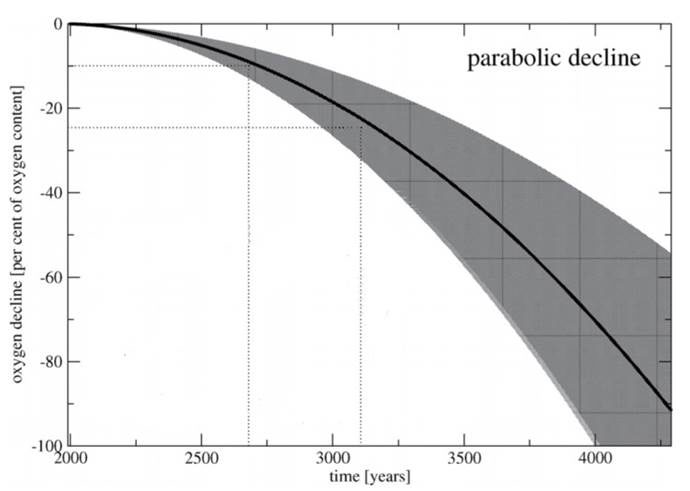
Figure 4 Parabolic decline to complete O2 depletion in 4 000 years
The new estimate for O2 depletion is much earlier than the 64 000 years predicted by Ralph Keeling in 1988 [4] based on contemporary fuel consumption. Livinia and colleagues commented that the 1988 estimate may be far too optimistic [2], as technological changes and population growth would be expected to speed up consumption of fossil fuels, while the production of fertilisers and other materials would also consume atmospheric O2. That was why they embarked on the new analysis. The problem of atmospheric oxygen deficiency should be addressed in advance, they said, before drastic changes take place, as in the recent problem of the ozone hole. “Too many environmental problems have been analysed by humanity in retrospect.” The purpose of their paper is to make an “advance warning”.
Livinia and colleagues also carried out tipping point analysis on the O2 data. Tipping point analysis is a mathematical technique for identifying bifurcation or tipping points (points of sudden changes) in time series data.
The oxygen data analysed by tipping point analysis do not indicate critical behaviour in fluctuations. The transitional behaviour is defined solely by the trend. They used the derived analytical parabolic trend to project the long-term decline of the oxygen concentration. Given the exponential growth of population and consumption, the trend is unlikely to be linear and as slow as Keeling estimated. Instead, they predict health-threatening problems for humans and other animals in one thousand years or sooner.
It is not only direct fossil fuel burning that reduces the oxygen level. There are various indirect factors that may accelerate oxygen depletion. For example, if we assume that world population stabilises and stops growing exponentially, and transport use stops growing at all, oxygen may still continue to decline due to increases in soil fertilisation and production of synthetic materials. In the past 10 years, the use of fertilisers has increased by 35 % per hectare of arable land. This one factor alone may become critical in terms of oxygen depletion within a few decades, if the dynamics remain the same. It has been pointed out [6] that previously neglected anthropogenic disturbances to the nitrogen cycle, especially nitrate fertilizer industrial production and nitrification, have driven the cycle to a more oxidised state. Similarly, recent changes in biomes, especially the conversion of natural forests into cultivated land, have caused carbon within the terrestrial biosphere to become increasingly more oxidized over a period of decades [7].
It is also necessary to factor in population increases in population and in transport, even with new technologies such as hydrogen fuel cells [2]. World Bank statistics report global carbon emissions from transport rising from 2.5 to 6 x 10¹² kg since 1970, and increase in the number of cars per 1 000 people around the globe from 100 to 130 since 2000, while population increased from 6 to 7.1 x 10⁹ during the same period. That means exponential growth of population will lead to exponential growth not only of carbon emissions but also of air oxygen consumption. Replacing direct fossil fuel combustion by new technologies like fuel cells may restrict carbon emissions but not necessarily the use of air oxygen. For example the hydrogen fuel cell has a net reaction: 2H2 + O2 ⟶ 2H2O. In addition to this use of oxygen, hydrogen production requires oxygen directly or indirectly, either in high temperature-pressure technologies using fossil fuels or in fertilisation for the production of biofuels. That means current industrial hydrogen fuel technologies maintain double sinks for atmospheric oxygen, because they use oxygen when hydrogen is synthesized, and combust oxygen when hydrogen is used as fuel.
The production of cement and fertilisers, petrochemical products of various types (oils, waxes, greases, explosives, rubbers, alcohols, asphalts), fuel cell operation and manufacturing, energy and heat generation, all require atmospheric oxygen for their industrial cycles. The Haber-Bosch process N2 + 3H2 ⟶ 2NH3 for producing nitrogen fertilisers uses methane from natural gas as the source of hydrogen, at a temperature of 300 – 500 ˚C and pressure of 150-250 bars, which requires energy and oxygen consumption.
A future-technology scheme that combines green generation and storage of fuel with increased efficiency of engines is needed.
Livinia and colleagues stated at the end of their report [2]: “We suggest that all industrial processes introducing new technologies with air consumption should be assessed regarding oxygen depletion before they are deployed at full scale.”
More than that, we need to divest from fossil fuel investments and leave oil in the ground (see [8] Age of Oil Ending? SiS 65). Our goal of [9] Green Energies 100 Percent Renewables by 2050 (ISIS/TWN special report) is within sight. A low-carbon economy is not enough; even more importantly, it needs to be low-oxygen or better yet oxygen positive, in order to make up for the losses already incurred.
Article first published 18/05/15
Comments are now closed for this article
There are 6 comments on this article.
Rory Short Comment left 19th May 2015 03:03:44
This agrees with my simple logic on this matter. It goes as follows humans are using up an increasing amount of oxygen and at the same time destroying more and more of the life forms which produce it. Just now we are going to run out of oxygen, an extinction event for all aerobic life forms.
Chen I-wan Comment left 20th May 2015 19:07:35
Appreciate warnings raised by this paper, which correspond and update the warnings by a paper I wrote and published in 2006:
The English title and abstract included in the presented paper:
Atmospheric “Oxygen Depletion” is an Even More Disastrous Consequence than the “Global Green House Effect” to the Continuance Healthy Survival of Mankind
-- Published in Chinese by Proceedings of the 3rd (Shanghai) Environment Protection and New Energy International Forum, Oct. 30 - 31, 2006, Shanghai, China
Chen I-wan (cheniwan@263.net)
Advisor,
Committee of Natural Hazard Prediction for China Geophysics Society
Committee of Disaster Historical Studies for China Disaster Prevention Association
Abstract: Reveals the core issue of the comprehensive complex massive system problem of “energy & atmospheric pollution” today is still unrecognized by most members of the world science and technology community and all members of the world industry: Excessive burning of fossil fuel and “new fuels” not only causes disastrous consequence of “green house effect global warming”, but at the same time also cause another disastrous consequence of atmospheric “oxygen depletion”. Reviews the formation and changes of the oxygen and carbon dioxide contained in the Earth’s atmosphere; and the dramatic fluctuation of atmospheric oxygen content during the Earth’s history and serious effect on the biosphere; presents science evidence of continuance reduction of global atmospheric oxygen content; warns that “Hydrogen Energy, Hydrogen Economy” will more seriously cause atmospheric “oxygen depletion”. Stress that most serious atmospheric “oxygen depletion” problem exists in major cities and advance developed economic regions! Summarizes conclusive opinions by Western medical and nutrition experts, biochemists on the effects of lack of oxygen to human health and illnesses, proposes scientific definition and significance of atmospheric “oxygen depletion”. Emphasizes the top priority evaluation parameter of “city life environment quality” must be the “city atmosphere quality” including the atmospheric oxygen content level. Reveals the “Atmospheric Environment Quality Standard” issued by the Chinese Government contains serious error and limitation, call for the Chinese government to also include monitoring of atmospheric carbon dioxide and oxygen content to the “Monitoring Standard of Atmospheric Environment Quality” of China.
The Chinese paper is available at my blog:
http://blog.sina.com.cn/s/blog_4bb17e9d0102v296.html
http://blog.sina.com.cn/s/blog_4bb17e9d0102v293.html
Todd Millions Comment left 29th May 2015 14:02:39
Powerfully presented, which is good. New methods of explaining exponents to people in double or nothing addicted societies ,is going too prove a challenge. Especially when various layers of mafias from banksters to churches continue too spend so much effort too make sure people don't understand these- 'preccesing' curves on any level via any model. Has ocean die off of pyto plankton being fit too these models? Has methane levels from leaks rising to stratosphere and oxidizing-causing a rain of dry ice and water/ice mixtures while reducing the ozone in these reactions? Radiation levels in water and air, from Israeli 'secured' reprocessing facilities that blow up 15 minutes before waves hit? Further' beautiful synergies' with this can off us in considerably(exponentially) sooner time scales.
Cheers!
Gail Zawacki Comment left 29th June 2015 21:09:36
In addition to vast deforestation, trees are simply dying, all over the world. The trend is accelerating and crosses all species and ages of trees. The underlying cause is ozone, which is highly toxic to vegetation.
This problem is ignored or denied by almost all professional foresters and climate scientists, even though forests are a crucial carbon sink, and a vital source of oxygen.
A short video about this issue: https://www.youtube.com/watch?v=sn1Xy_j48k0
John Walker Comment left 3rd July 2015 06:06:09
Your "mystery of the oxygen sink" is simply an oversight on your part. While it is true that currently atmospheric O2 is falling faster than atmospheric CO2 is climbing, you are ignoring the natural and ongoing carbon cycle sequestration of a large portion (~60%) of global man made CO2 emissions. Total fossil fuel based CO2 emissions for 2014 were 32.5 Giga tons/yr. The 2ppmv annual increase of atmospheric CO2 accounts for around 15 Gt of that. The other 17 Gt of CO2 are sequestrated. These 2 parts of the CO2 amount exactly covers the amount of depleted oxygen.
33 gt co2 emission man made from all sources
gas 7 gt
coal 14 gt
oil 12 gt
co2 400ppmv
co2 3000 gt global atmo.(2.1ppmv increase/yr = 15 gt(0.5% v 400ppmv = 3000 x 0.005))
carbon cycle 800 gt co2
Human contribution ~ 4%
o2 209500ppmv
4 ppmv o2 decline/yr
o2 1.2 million gt
o2 23 gt decrease/yr
Frank Mancuso Comment left 31st December 2015 23:11:27
This June it has been discovered that phytoplankton is ingesting marine micro plastic. This fact changes all the studies and escalates the oxygen depletion scales for the following reason. As ocean plastic decomposes it absorbs PCB's hence sealing the fate of phytoplankton. The depletion will be abrupt and irreversible.