New studies confirm that the nuclear option is inherently unsustainable as well as unsafe and uneconomic. Dr. Mae-Wan Ho
Veteran ecologist Peter Bunyard was spot on in his article [1] Deconstructing the Nuclear Power Myths (SiS 27), which showed that nuclear is not a renewable energy, and apart from being extremely uneconomical and unsafe, it is highly unsustainable in terms of savings on energy and greenhouse emissions; in fact, worse than a gas-fired electricity generating plant as high grade uranium ore is depleted and available ore falls below 0.02 percent. This has been amply confirmed by studies carried out since.
A report published in 2008 [2, 3] shows that in order to replace fossil-fuel energy use and meet the future energy demands, nuclear energy must increase by 10.5 percent each year from 2010 to 2050. This large growth rate creates a “cannibalistic effect”, where nuclear energy must be used to supply the energy for future nuclear power plants.
Joshua Pearce, a physicist at Clarion University of Pennsylvania, finds he cannot balance the books if nuclear power option is taken in preference to renewable energy sources. The enormous amounts of energy needed for mining and processing uranium ore, building and operating the power plant simply cannot be offset in a high growth scenario. In particular, growth limits are set by the grade of uranium ore available, confirming earlier studies [1] (see later).
As is well known, on account of safety reasons and scale of operation, nuclear plants are far away from users and transmission over long distances incur a loss of at least 6 percent of the electricity generated. For the same reasons, most of the heat produced, 60 percent or more, is also wasted. This waste heat, Pearce reminds us, directly warms the earth.
The lifecycle assessment (LCA) Pearce carried out shows that nuclear energy costs between 16 to 55 g CO2e/kWh, based on current practice in the United States with regard to mining and enrichment of uranium ore, and does not include reprocessing or decommissioning, but includes spent-fuel disposal and the deconversion of depleted uranium (back to U3O8). It falls short of a genuine “cradle-to-grave” LCA [4] (see Which Renewables, SiS 39).
The estimated energy payback time and the emissions payback time – the time it takes to generate as much energy as is used and to save as much CO2e as was expended in the complete lifecycle – are very dependent on the grade of uranium ore and on the energy mix of the area where the nuclear plant is located. For example, the energy pay back time is between 5.5 years and 92 years with the US energy mix, while 1.5 to 12 years are estimated for the European energy mix for a high ore grade of 0.1 percent; the corresponding figures for an ore grade of 0.01 percent are 7 years to infinity (no payback) in the US and 4 to 46 years in Europe. Clearly, these figures are way out of line with those of renewable, sustainable options such as wind and solar [4-6] (Solar Power to the Masses, Solar Power Getting Cleaner Fast, SiS 39), which are immediately available and rapidly gaining ground.
Pearce suggests efforts to be made to improve efficiency of nuclear power, using only the highest concentration ores and switch to fuel enrichment based on gas centrifuge technology instead of gaseous diffusion, use of combined heat and power generation for nuclear plants and down-blend nuclear weapons stockpiles containing highly enriched uranium to produce nuclear power plant fuel (though that too, is a limited stock).
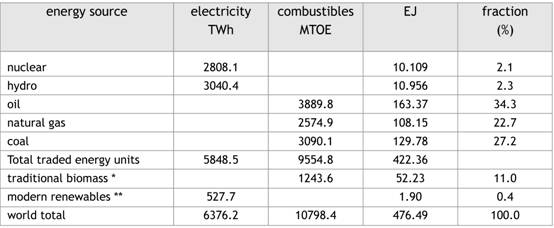
For all the fuss about nuclear energy, it actually accounts for a mere 2.1 percent of the energy used globally in 2006 [7] (see Table 1). The nuclear contribution to the world electricity generation was 14.8 percent; and has been slowly declining from a peak of some 17 percent in the early 1990s.
Hence, as pointed out by Jan Willem Storm van Leeuwen, Senior Scientist of Ceedata Consultancy in Chaam, The Netherlands, nuclear energy cannot reduce the world’s greenhouse emissions (or fossil fuel use) by more than 2.1 percent. This sums up the absurdity the “nuclear renaissance”, and all the more so when the sums are worked out in detail.
Table 1. Energy available globally in 2006
 .
.
By far the most thorough LCA on nuclear energy has been carried out by Jan Willem Storm van Leeuwen and Philip Smith originally in 2005 [8], and subsequently updated and extended by the first author [9] partly in response to critics from the nuclear industry.
The only natural element that undergoes nuclear fission from which nuclear nuclear power can be harnessed for use in a reactor is uranium-235 (U-235). This radioactive isotope accounts for 0.71 percent of natural uranium, the remaining is U-238.and with traces of U-234, neither of them fissile (capable of being split). In an operating nuclear reactor, a part of the abundant U-238 is converted by neutron capture into plutonium-239, which is fissile.
There are two kinds of nuclear reactors: burners and breeders. In a burner reactor, no more than 0.6-0.7 percent of the atoms in the natural uranium in the fuel can be split. The rate at which U-238 converts into fissile plutonium is less than that at which U-235 and Pu-239 are split. When the fissile content of the fuel in the reactor falls below about 0.8 percent, the fuel has to be replaced by fresh fuel.
In a breeder reactor more fissile Pu-239 and Pu-241 are formed than are split. Theoretically, some 30-60 percent of the natural uranium could be split in this way. But breeder reactors remain technically unfeasible. A breeder reactor is not just a single structure, but involves a reprocessing facility and a fuel fabrication plant in addition; and all three components have to be operating flawlessly and continuously, exactly tuned to the others. If one component fails, the whole collapses. None of the three components has ever been demonstrated to operate as required, and that after 50 years of intensive research efforts and hundreds of billions of dollars invested in 7 countries: USA, UK, France, Germany, former USSR and now Russia, Japan and India. Technical hurdles are not the only problems, also safety, economy and the risk of nuclear proliferation and terrorism.
More than 88 percent of world’s nuclear reactions are light water reactors, and achieve a lifetime uranium utilization of less than 0.6 percent, which means that for every kg of uranium delivered by the mine, 994 g leave the nuclear reactor as depleted uranium in highly radioactive spent fuel. Advanced ‘Generation III’ reactors and the Pebble Bed Reactor [10] (Safe New Generation Nuclear Power? SiS 29) may reach uranium utilization slightly higher than 0.6 percent, but that remains speculative.
In the once-through mode, no uranium and plutonium are recycled, so spent fuel is not reprocessed. Several studies have concluded that the reprocessing and the use of mixed oxide (MOX) fuel are unjustified on grounds of safety, efficiency and risks of proliferation [1, 11] (see Nuclear Industry’s Financial & Safety Nightmare, SiS 40)
The world’s nuclear power capacity is 370 GW, which is roughly equivalent to 400 reactors of 1 GW each. A LCA was therefore carried out on a ‘reference reactor’ which is a 1 GW light water reactor of current design operating without plutonium recycling for a lifetime of 30 years at an average load factor (ratio of output over capacity) of 0.82. The lifetime and load factor assumed are considerably better than what real reactors have achieved so far.
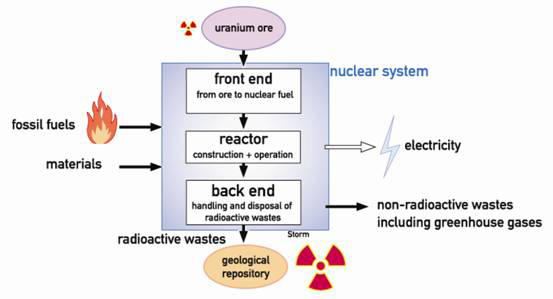
The stages in the nuclear chain at which energy inputs are required are depicted in Figure 1 [12].

Figure 1. Simplified nuclear chain for lifecycle assessment
The ‘front end’ processes include mining and milling of the uranium ore U3O8, conversion into UF6, enrichment by gaseous diffusion or gas centrifuge and fabrication of the fuel assembly.
The ‘reactor’ processes include construction of the power plant and operation where the fuel is burnt and the heat produced used to drive a turbine/generator to produce electricity. Operation costs includes controlling the fission process so it doesn’t go ’critical’ as in an atom bomb [1], and making up materials and chemical and non-radioactive waste management.
The ‘back end’ processes are the most demanding, and also often ignored. They include first of all retrieving spent fuel, deconversion, and storing it at the reactor site for further reprocessing or disposal. Nuclear wastes from power stations will remain dangerous to humans for generations, which is why they have to be stored permanently. Also included is decommissioning the power plant once its useful and safe lifetime is over.
The nuclear industry is effectively ignoring decommissioning, which involves a long drawn-out and demanding series of step. First, the reactor has to be cleaned up and safeguarded for a cooling period of 30-100 years after closedown. The radioactive parts of the nuclear island have to be dismantled after cooling, and the radioactive scrap and rubble packaged to prevent the illegal trade in radioactive scrap, which is already a problem today. The spent fuel removed from the reactor has to be stored for at least 30 years in heavily protected and safeguarded facilities, bearing in mind that one reactor produces during its lifetime an amount of radioactivity equal to about 10 000 exploded nuclear weapons; and corrosion and leaking fuel pins may pose a problem in addition to protection against terrorist attacks. The spent fuel then has to be packaged in containers able to last for many thousands of years in contact with hot and salty water under continuous nuclear radiation. A stable geological repository has to be constructed to isolate the spent fuel from the biosphere for hundreds of thousands of years. Over a period of decades, the canisters with the spent fuel will be placed into boreholes in the floors of the numerous galleries in the repository, and when fully occupied, the galleries and access tunnels have to be filled up with bentonite and closed forever.
The reference reactor for the LCA produces about 20 Mg spent fuel a year. Assuming a lifetime of 30 years, each reactor produces about 600 Mg spent fuel.
Assuming the world nuclear fleet to be 400 reference reactors, 8 000 Mg spent fuel has to go into storage each year worldwide. Even if exceedingly large repositories will be constructed, larger than the planned Yucca Mountain repository in the USA, a new repository has to be opened every ten years, and a full one closed up.
In addition, the uranium mine has to be reclaimed, an area of up to about 100 km2. The tailing, containing large amounts of chemically and physically mobilized radioactive species, have to be isolated from the groundwater and the air. Existing reprocessing plants such as Sellafield in the UK and La Hague in France will have to cleaned up and dismantled. This activity will be extremely demanding. In the UK, the estimated costs are about £73 billion and rising [11].
None of the decommissioning processes is operational at this moment, and no satisfactory practical solutions for a number of the problems have been found during the past 40 years. Geological repositories exist still only on the drawing boards.
So, the energy requirements and CO2 emissions of the back end decommissioning processes are estimated by comparison with similar industrial processes where data do exist.
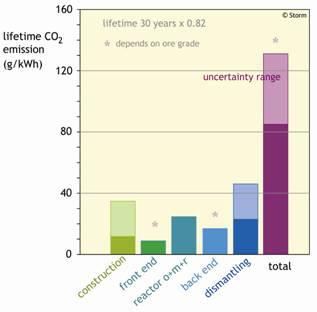
Figure 2 presents the summary of LCA for a uranium ore grade of 0.15 percent, which is the mean value of available uranium ore grade for the world in 2005 [13]

Figure 2. The lifetime CO2 emission for the reference nuclear system
As can be seen, the lifetime greenhouse emission is well over 85 g CO2e/kWh or more. And this is likely to go up considerably.
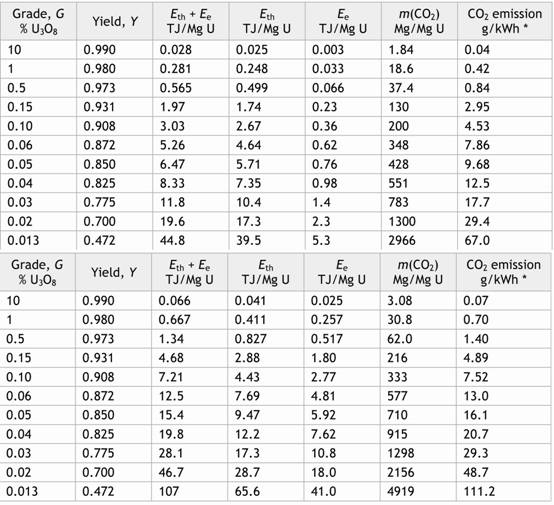
The grade of uranium ore used is critical in determining the lifetime greenhouse emissions and energy savings. The yield of uranium (proportion of available uranium extracted from the crude ore) decreases roughly linearly as the ore grade goes down; the amount of energy needed for extracting in mining and milling, however, goes up exponentially, as does carbon emission. This is summarised in Table 2, based on empirical data [14]
Table 2.Energy and CO2 costs of mining and milling as a function of uranium grade for soft (top) and hard (bottom) ore

Eth refers to thermal energy, Ee refers to electrical energy.
According to the Oxford Research Group [13], just keeping up with the existing nuclear capacity would deplete the high grade ores so that by 2016, the mean uranium ore grade available would reach 0.1 percent or less. And at some time between 2066 and 2076, when average ore grade decreases to 0.02 percent or less, uranium fuel reactors would fall off the ‘energy cliff’ i.e., consume more energy than they generate, and produce more CO2 emissions than a gas-fired power plant
Article first published 29/09/08
Comments are now closed for this article