 |
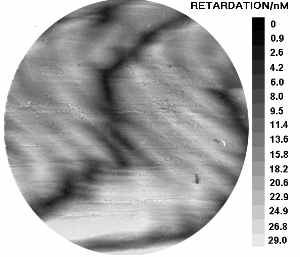 |
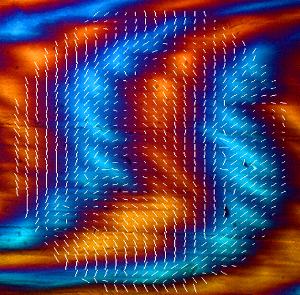
| a)Dogfish egg case as viewed under polarised light. Hold the mouse over the image to see the corresponding orientation overlay. b)Image map representing the variation in relative retardation across the above sample. |
To perform quantitative analysis using this technique, it is necessary to measure the relative intensity of a small area, as it is rotated relative to the polarisers. We have developed a computerised system for analysing larger areas, with our industrial partners Prior (microscopy), Datacell, and Ross research. A computer controls a motorised stage, and image aquisition card, allowing the capture and intensity analysis, of a sample at a number of orientations. The software (Image pro plus) is then able to compare the sample at each orientation to determine where the maximum and minimum intensities occur. From this data, the software can then create an overlay demonstrating molecular orientation (hold the mouse over the image to see this).
This technique has been applied to a range of different samples - mainly fixed biological liquid crystalline arrays, but also thin sections of stone.
The examples shown are of dogfish eggcasing collagen, and granite. To display the molecular orientation overlay, hold the mouse over the images, and it will appear.
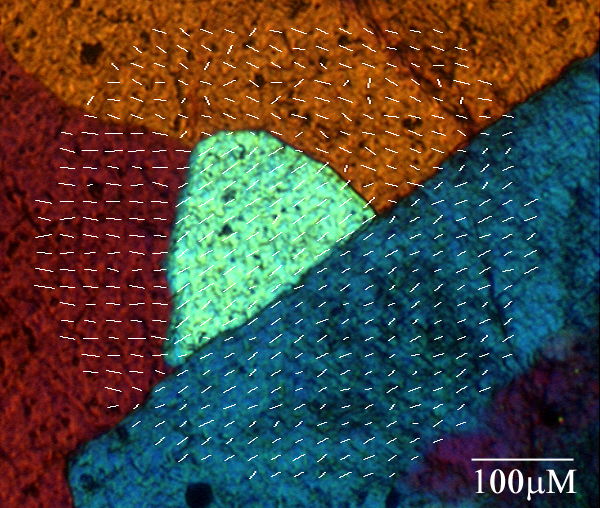 |
| a)Thin section of granite viewed under polarised light. Hold the mouse over the image to see the corresponding orientation overlay. |
Article first published 01/01/01
Comments are now closed for this article