Life cycle assessments are revealing just how much we can reduce greenhouse gas emissions and save on energy use with different renewable options Dr. Mae-Wan Ho
The electricity industry currently contributes about 37 percent of the world’s carbon emissions, predominantly from burning fossil fuels while electricity is generated [1]. The best option for reducing carbon emissions is to substitute renewable energy resources for fossil fuels. Our recent report [2] Food Futures Now (I-SIS publication) shows how a radical change in the way we produce and distribute food as well as energy can indeed free us from fossil fuels altogether.
Renewable energies such as solar and wind do not emit carbon dioxide while generating electricity, and have the further advantage that it can improve the efficiency of energy use considerably. Big power plants are located far away from most users, so the electricity generated has to be transported long distances over power lines where more than 7 percent may be lost before it is used. In addition, some
60-70 percent of the energy is lost as ‘waste’ heat while generating electricity. In contrast, solar panels and wind turbines are readily installed on or near homes and farms and the electricity generated as well as the heat can be consumed directly without much loss.
A ‘cradle-to-grave’ life-cycle assessment (LCA) is one that includes upstream processes such as mining, refining, transport and plant construction, the production of the device or equipment, the generation and distribution of electricity, and downstream processes such as decommissioning and disposal of wastes. This will give us a clearer idea as to how much better off we are with renewable electricity generation, and how different renewable options compare with one another.
In LCA, the main environmental performance indicators are as follows [3].
Energy intensity h, is the ratio of the total energy used for construction, operation and decommissioning E, to the electricity output of the plant/device over its lifetime Et.
h = E/ Et (1)
Et = P x 8760h/y × l x T
where P is the power rating, l is the load factor (def) and T the lifetime. The inverse of energy intensity is the energy payback ratio (EPR), and is considered one of the most reliable indicators according to the International Energy Agency. A high EPR indicates good environmental performance. An EPR of 1 or less indicates it consumes as much energy as it generates, so it should never be developed.
Energy payback time (EPBT) is the time it takes for the energy technology to generate the total energy requirement for construction, operation and decommission.
EPBT = E ×εfossil × T/ Et (2)
where εfossil is the conversion efficiency.
Both EPBT and EPR tell us how much conventional energy we use today in order to obtain energy to-morrow.
Environmental impact (EI) assesses impact on the ecosystem. The general categories are acid rain potential, photochemical oxidants, global warming potential, etc. Other categories are impact on wildlife, loss of biodiversity, water quality, especially applicable to geothermal and marine energy technologies, including run-of-river hydro, tidal energy and wave energy, which still need to be carried out.
There are two major approaches to LCA: a process-based model developed mostly by the Society of Environmental Toxicology and Chemistry (SETAC) and the US Environment Protection Agency (EPA), and an economic input-output analysis referred to as EIO-LCA. The SETAC-EPA approach divides each product into individual process flows and identifies and quantifies EIs. This model includes all the various manufacturing, transport, mining and related requirements for making the product or service. The EIO-LCA traces out the various economic transactions, resource requirements, and environmental emissions required for a particular product or service. It uses sectors of the economy rather than specific processes, and also has difficulties analysing the use and disposal phases of certain products.
The renewable technologies for which most of the LCA work has been done are biomass, photovoltaic and wind energy. For example, the EPBT for onshore and offshore wind turbines in Denmark in 2000 were 0.26 and 0.39 y respectively, excluding glass and polyester because data did not exist, and about 94 percent of the materials of the wind turbine can be recycled. A study published in 2005 on 2.7kW PV systems found it consumed only 23 percent of the total primary energy of an oil-fired steam turbine plant, but its EPBT was a couple of months higher. The lifetime GHG emissions for the oil-fired steam turbine plant were about four times those of the PV systems. For biomass electricity, the LCA of wood-fired power plants in the range of 5 to 30 MW in Britain, the energy intensity is 0.25 to 0.27, and the CO2 emission is 65 g per kWh. A further analysis showed that an integrated biomass gasification combined cycle (IBGCC) power plant is superior to an integrated coal gasification combined cycle (IGCC) plant in terms of resource depletion and GHG emissions, whereas IGCC is better in terms of acidification and eutrophication.
Many factors contribute to environmental performance. The lifetime, power ratings, load factor (the output of a power plant compared to the maximum output it could produce), type and maturity of technology, country of manufacture, the type of material used, and method of decommissioning, all influence the energy intensity.
For example, in the case of a wind turbine, it is 0.049 for a steel tower and 0.041 for a concrete tower. The manufacture of a 500 kW German wind turbine in Brazil requires almost twice as much primary energy as one manufactured in Germany. And it is less energy intensive to recycle completely, or overhaul and reinstall after the service life is over than to recycle individual components.
Different LCA methodologies will also give different energy intensity for the same wind turbine. For example, the input output analysis gave higher energy intensity than process analysis because the former included more detailed information.
The environmental performance of PV technology differs in different countries. For Germany, the low irradiance reduces the EPR, but because it substitutes for a relatively dirty grid, CO2 emission is reduced by 10.1 tonnes per kW of PV installed.
LCA can be used to assess the environmental performance of alternative energy scenarios. It has been shown that the CO2 emission per kWh for PVs can be reduced from 217 g to 68 with three improvements: in manufacturing technology, by changing the supporting structure to reduce aluminium use, and by increased efficiency of the solar cell. A study published in 1996 showed that the EPR could be increased from 2.4 to 6.7 using a ‘solar breeding system’ in which PV technology supplies electricity to produce further PV technology.
For bio-energy (biomass and biofuels), inorganic nitrogen fertilizer inputs have a strong influence on overall performance, accounting for 37 percent of non-renewable fossil energy input. Substituting for inorganic N fertilizer with sewage sludge ‘bio-solids’ could increase the EPR of willow biomass crop production by more than 40 percent.
A 2005 LCA showed that amorphous silicon solar cells emit 44 g CO2/kWh of electricity generated compared to 75 g for multicrystalline cells. Another LCA published in the same year found that the installation of 2.5kW PV on the ground yields 141 g CO2/kWh electricity generated, which is an order of magnitude higher than hydro and wind, but an order of magnitude lower than coal.
For comparison, a summary of the EPR and CO2 emissions of different renewable and non-renewable energy power plants are listed in Table 1 [3].
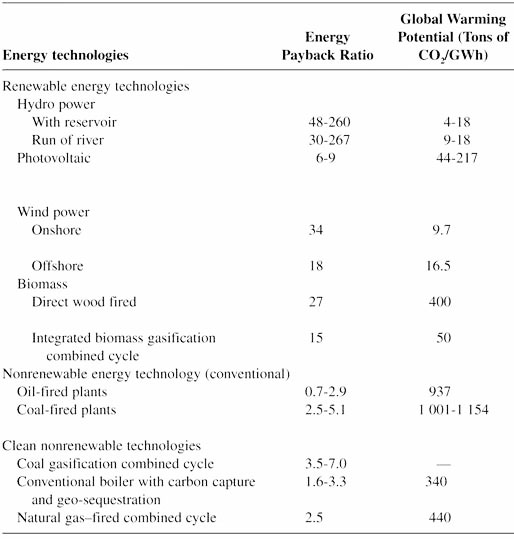
Table 1. EPR and CO2 emissions of different renewable and non-renewable energy power plants
As can be seen, conventional coal power plants have the highest emissions followed by oil, natural gas, biomass. Hydro and wind have the lowest emissions.
Photovoltaic technologies are advancing rapidly; the environmental indicators improve year by year [4] (see Solar Power Getting Cleaner Fast, SiS 39) and approaching those for wind and hydroelectric.
Article first published 30/07/08
Comments are now closed for this article