Thin Film CdTe under the Spotlight Dr. Mae-Wan Ho
Solar power tops the list of renewable energies in the world, both in installed capacity and rate of growth. Solar photovoltaic – generating electricity from sunlight – has been growing the fastest, driven by technological advances that bring prices down, as much as by government policies such as feed-in tariffs [1] (World Reached 25 % Renewable Energy Capacity, SiS 49). But how green is solar energy? A particular worry is the toxicities of metals such as cadmium that goes into the new thin film PVs.
The Silicon Valley Toxics Coalition based in San Jose California in the United States carried out a survey early in 2010 comparing environmental health and safety practices, recycling policies and sustainability among 14 major solar panel manufacturers that represent about a quarter of the global solar panels market share [2, 3]. German companies scored the highest overall: Calyxo, Solarworld and Sovello; Yingli in China came fourth. US-based First Solar and Abound Solar followed. There was no response from several major manufacturers including Sharp, Miasolé, Best Solar and Solyndra.
The survey also found that:
It is important to perform life-cycle analysis as well as environmental and health impacts of renewable energy options, and end of life recycling should be mandatory, especially for toxic components, such as cadmium or cadmium telluride.
Researchers led by Vasilis Fthenakis at Columbia University, New York, in the United States, have been carrying out life-cycle analysis of solar panels ([4] Solar Power Getting Cleaner Fast, SiS 39). In the most recent comprehensive update, the analysis start from raw material acquisition, through material processing, manufacturing, use, decommissioning, treatment/disposal and recycling, if any, accounting for the material and energy inputs, and waste effluents to air, water or ground [5].
The material and energy inputs and outputs during life cycles of silicon photovoltaics (Si PVs) and thin-film cadmium telluride (CdTe) PVs were investigated in detail based on actual measurements from PV production plants between 2004 and 2006.
They used the most up-to-date data from researchers on life-cycle inventory (LCI) for producing crystalline silicon modules in Western Europe under the framework of the Crystal Clear, a large European Integrated Project focusing on crystalline silicon technology, co-funded by the European Commission and the participating countries. The LCI data for CdTe thin-film technology were taken from the production data of First Solar’s plant in Perrysburg, Ohio, United States.
The typical thickness of multi- and mono-Si PV is 270–300 mm, and that of ribbon-Si is 300–330 mm; 72 individual cells of 156 cm2 (125 cm x 125 cm) comprise a module of
1.25 m2 for all Si-PV types. The conversion efficiency of ribbon-, multi-, and mono-Si module is 11.5, 13.2, and 14.0 percent, respectively. As of 2006, First Solar’s 25-MWp plant manufactures frameless, double-glass, CdTe modules of 1.2 m by 0.6 m rated at 9 percent efficiency with ~3mm thick active layer, a hundredth the thickness of the silicon PVs.
An important part of the solar panel installation that has not been considered in previous life-cycle analysis is the ‘balance of system’ (BOS), all components other than the PV panels needed for supporting the panels and for their operation.
Silicon modules require an aluminium frame of 3.8 kg/m2 for mounting, while a glass backing performs the same functions for the CdTe PV. For rooftop PV, the BOS typically includes inverters, mounting structures, cable and connectors. Large-scale ground-mounted PVs require additional equipment and facilities, such as grid connections, office facilities, and concrete. The mass of this was 9 to 10 times the panels for a 3.5 MW installation in Springville, AZ.
The most frequently measured life-cycle metrics of PV system environmental analyses are the energy payback time (EPBT) and the greenhouse-gas (GHG) emissions. EPBT is the period required for a renewable energy system to generate the same amount of energy that we used to produce the system itself. Calculating the primary energy equivalent requires knowledge of the country-specific fuels, feedstock and technologies used to generate energy.
The EPBTs are shown in Figure 1. As can be seen, CdTe PVs have the lowest values by far, one year in Europe and slightly over one year in the US.
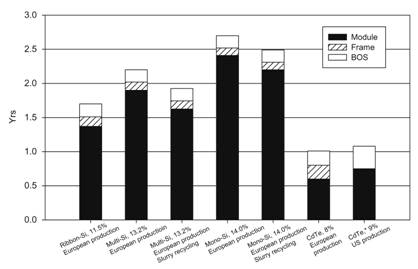
Figure 1 Energy payback time for different solar PVs
The greenhouse-gas (GHG) emissions during the lifecycle of a PV system are estimated as an equivalent of CO2 using an integrated time period of 100 years; the major emissions included as GHG emissions are CO2 (global warming potential, GWP = 1), CH4 (GWP = 23), N2O (GWP = 296), and chlorofluorocarbons (GWP = 4600–10 600).
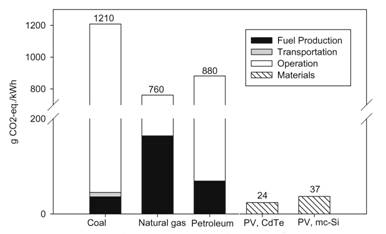
Figure 2 Greenhouse gas emissions for solar PVs compared with some non-renewable sources
Again, CdTe PVs emissions at 24 g per kWH come out ahead of silicon PVs at 37 gm per kWh. These are way below those of coal natural gas and petroleum. I have omitted the GHG emissions of nuclear given in the authors’ graph at 24 g, the same as CdTe PVs. This value was way below that resulting from a detailed realistic analysis, which put nuclear GHG emissions at between a minimum of 85 g and a maximum of 130 g per kWh ([6] The Nuclear Black Hole, SiS 40).
Electricity and fuel use during the PV materials and module production are the main sources of the GHG emissions for PV lifecycles. Upstream electricity-generation methods also play an important role in determining the total GHG emissions. For instance, the GHG emission factor of the average US electricity grid is 40 percent higher than that of the average Western European (UCTE), resulting in higher GHG estimates for the US – produced modules. It is clear that improvements in material and energy use and recycling will enhance the environmental profiles.
A recent, major improvement is a recycling process for the sawing slurry, the cutting fluid that is used in the wafer cutting. This recycling process recovers 80–90 percent of the silicon carbide and polyethylene glycol that was previously wasted, and decreases the EPBTs of these technologies by 10 percent.
Other waste gases were compared. Emissions of NOx and SOx from CdTe PVs at 42 mg/kWh and 79 mg/kWh are about half of those of the silicon modules.
Toxic heavy metal emissions are a major concern during the extraction, manufacturing process and during use.
Cadmium is a byproduct of zinc and lead, and is collected from emissions and waste streams during the production of these major metals. The largest fraction of cadmium, ~99.5 percent pure, is in the form of a sponge from the electrolytic recovery of zinc. This sponge is
transferred to a cadmium-recovery facility, and further processed through oxidation and leaching to generate a new electrolytic solution. After selectively precipitating the major impurities, cadmium 99.99 percent pure is recovered by electro-winning. It is further purified by vacuum distillation for CdTe PV manufacture.
While cadmium emissions can take place throughout the extraction process, emissions during the lifespan of a finished CdTe module are negligible, as it is encased in glass. The only way it could be released is if a fire broke out. Experiments at Brookhaven National Laboratory that simulated real fire conditions revealed that CdTe is effectively contained within the glass-to-glass encapsulation during the fire, and only minute amounts (0.4–0.6 percent) of Cd are released. The dissolution of Cd into the molten glass was confirmed by
high-energy synchrotron X-ray microscopy studies.
Coal and oil-fired power plants routinely generate Cd during their operation, as it is a trace element in both fuels. According to the US Electric Power Research Institute’s
data, under the best/optimized operational and maintenance conditions, burning coal for electricity releases between 2 and 7 g of Cd/GWh. In addition, 140 g/GWh of Cd inevitably collects as fine dust in boilers, baghouses, and electrostatic precipitators (ESPs).
The emissions of Cd from heavy-oil burning power plants are 12–14 times higher than those from coal plants, even though heavy oil contains much less Cd than coal (~0.1 ppm), because these plants do not have particulate-control equipment. Cadmium emissions are also associated with natural gas and nuclear-fuel life cycles because of the energy used in fuel processing and material productions. Thus, displacing the conventional energy sources with CdTe PV markedly lowers the amount of Cd released into the air. Every GWh of electricity generated by CdTe PV modules saves around 5 g of Cd air emissions if used instead of, or as a supplement to, the Western Europe UCTE electricity grid.
The direct emissions of Cd during the life cycle of CdTe PV are 10 times lower than the indirect ones due to electricity and fuel use in the same life cycle, and about 30 times less than those indirect emissions from crystalline photovoltaics. The results are given in Figure 3.
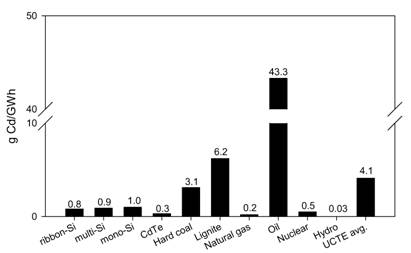
Figure 3 Cadmium emissions of PVs and other conventional sources
The authors also examined the indirect heavy metal emissions in the life cycle of the Si PVs and found that CdTe PVs has the fewest heavy metal emissions among PVs; the emissions of arsenic, chromium, lead, mercury and nickel are much less than the silicon modules.
A concentrator PV system, the ‘Amonix high-concentrator PV’ (HCPV) consists of units called MegaModules mounted on two-axis trackers. Each MegaModule is made up of 48 blocks of sub-module units rated at 3.8 kWp-AC each under 850 W/m2 of direct normal irradiance. A refractive concentration technology based on acrylic Fresnel lenses achieves an effective concentration ratio of 250. A piece of thin acrylic plate with 24 lenses 4 mm thick and antireflection coated, is mounted on each submodule. A total of 1 152 single-junction, single-crystal silicon cells, each 1.2 cm2 are mounted at the focal points of a MegaModule (see Fig. 4). This AM-10TM single-crystal solar cell operates at 26.5 percent efficiency. Arizona Public Service has installed and tested several Amonix HCPV systems with capacities of around 500 kWp, the largest being the 168 kWp installed at their PV plant near Prescott, Arizona. The data for analysis were obtained from the 24 kW system in APS STAR center in Phoenix.
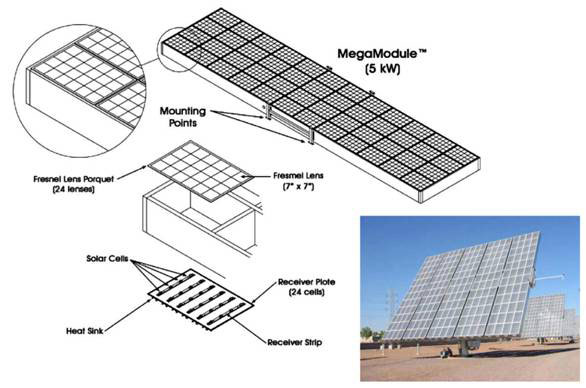
Figure 4 The Amonix MegaModule and complete 24 kW systems in APS STAR center in Phoenix, www. Ammonix.com
The major components of the 5-MegaModule 24 kWp system includes frames, optics, singlecrystal Si cells, heat sinks, tracker, foundation, hydraulic drive, motor, controller, inverter, sensor, power meter, and anemometer (a gauge for recording wind velocity). While the aperture area is 182 m2, the total area of the concentrator is 230 m2 including the frame areas. The trackers consist of a 5.5 m high pedestal, a torque tube and a hydraulic drive with a controller. The concrete foundation used in the STAR test facility in Phoenix, is 5.5 m deep and 1.2 m in diameter. Each 24 kWp MegaModule system has a 30 kW Xantrex inverter and multiple MegaModules share one transformer.
The direct beam solar radiation is on average 2480 kWh/m2/year in Phoenix, AZ. Performing with a 16 percent rated AC conversion efficiency, the installation should ideally produce 72 MWh (2480 x 0.16 x 182 m2) a year under standard conditions of 25 ˚C ambient temperature 1 m/s wind speed). However, it generated only 49.2 MWh in 2005, 30 percent less. Losses were put down to soiling, alignment, shadows between units and other objects, temperature, equipment failure.
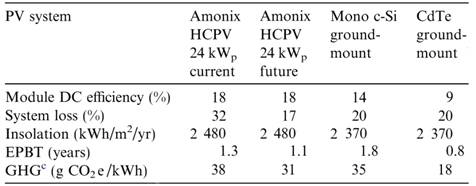
Table 1 gives the life cycle parameters of the concentrator utility compared with ordinary PVs. As can be seen, the ordinary PVs, especially CdTe PVs outperform the concentrator facility, the latter in both EPBT and CHG emissions. The CdTe thin film PVs looks like the clear winner for now. It shows that distributed small scale installations can work better than large utilities. And there is certainly more room for improvement, such as recycling toxic materials and better yet, finding non-toxic alternatives.
Table 1 Life cycle parameters of concentrator PV and ordinary PVs
Article first published 17/01/11
Comments are now closed for this article
There are 1 comments on this article.
Todd Millions Comment left 23rd January 2011 22:10:45
I do like these system/lifecycle overveiws.While extracting alumium(for the frame),from ore for example-is very energy intense.Recycling scrap alumium is a very low power operation.
One choke point on these efforts in any solar power system is the durability of glass-Last I checked,the insurance industry half life for the worlds structural glass was-10years.Rather close to the payback period for PV and thermal instalations,when half of them will break in a decade on even odds.Since normal low iron glass can be anealled with molten salt too be almost as tough as normal grades of pesplex(nearly as flexible too boot),and since there are quantities of waste heat from the glass melt furnaces and the tin float of any modern glass plant too melt the salt-this can only be as the glass companies like it.A problem that goes back to the empour Tiberius,according too some sources.
Given that the proliferation of small arms and idiots has accelerated so much in recent times(now blimps and other airships,can't be operated over populated areas anywhere,because of the expense of patching and repurifing/ replacing the heliun-due too pin heads with guns perishing too see if they can blow them up.),These durability issues sould be addressed.
As they are solved already techincally,impimentation efforts should perhaps be directed elsewhere.Politically-spare me.Perhaps it would best further too bring the uncost/benifit ratio of better glass to the attention of Swiss Re.By ajusting their rates,both cosumers and the factories that produce the glass could be encouraged too do what they should have found out and demanded themselves-30 years ago.