 |
  |
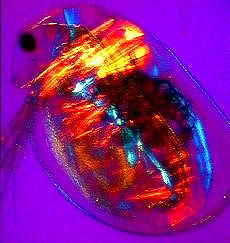
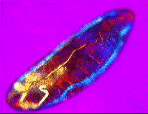
a) An adult water flea (Daphnia sp.) mag. x40, as viewed under the polarized microscope. b) detail of shoulder muscles, and c) muscular tissue from behind the head. |
The liquid crystalline nature of biological materials makes them ideal candidates for study with the polarised light microscope, however advances in computer imaging, and microscope controllability have allowed us to develop a technique that can not only present us with measurements of retardation but also molecular alignment. This technique is described briefly here, and in more detail in Quantitative Image Analysis of Birefringent Biological Material on this site - the purpose of this article to demonstrate some of our results using this technique
An adjustment to the standard polarised light microscope allows quantification of relative retardation and orientation for weakly birefringent samples , (relative retardation below 50nM - a typical value for thin sections of many biological materials.). The standard polarised light microscope set-up consists of a polariser both above and below the sample. They are crossed- their vibrational axes are at 90 deg. . As light passes through the first polariser it is split into two perpendicular rays, that will travel through the sample at different velocities, the slower wave being retarded relative to the fast wave. This difference is the relative retardation measured in nm. As the two rays leave the sample they are out of phase- the second polariser (or analyser) recombines the rays, where they interfere. For samples with a retardation of less than 200 nm, a compensator plate is added between the polarisers to bring this interference within the visible range. This plate is traditionally set at 45 deg. to the polarisers, however adjusting this angle by 4.5-7.5 deg. can dramatically increase the colour contrast, optimised for retardations below 50nM. When combined with the latest image capture and analysis software , motorised microscope stage and digital cameras it is possible to accurately evaluate both sample retardations and orientations, at individual points, or averaged over areas.
 |
 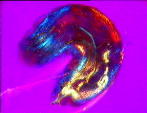 |
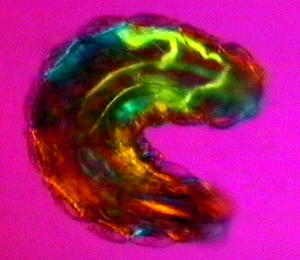
| a) Larvae of the fruit fly Drosophila melanogaster mag. x100, as viewed under the polarized microscope. b) The larvae undergoes waves of contraction along its body before c)hatching. |
The technique itself was discovered by Mae-Wan Ho and Michael Lawrence whilst examining developing, and freshly hatched fruit fly larvae (Drosophila melanogaster). In her book The Rainbow And The Worm, Dr. Ho describes the living embryo as if it were 'straight out of a dream' - indeed the living organism viewed in this technique is an amazing sight. She goes on
....As it crawls along, it weaves its head from side to side flashing jaw muscles in blue and orange stripes on a magenta background. The segmental muscle bands switch from brilliant turquoise to bright vermillion, tracking waves of contraction along its body. The contracting body-wall turns from magenta to purple , through to irredescent shades of green, orange and yellow. The egg yolk, trapped in the alimentary canal, shimmers a dull chartreuse as it gurgles back and forth in the commotion. A pair of pale orange tracheal tracts run from just behind the head down the sides terminating in yellow spiracles at the posterior extremity.
Interestingly enough all organisms examined were polarized along the anterior-posterior axis, the colours of the different tissues of the body are at a maximum when the axis is appropriately aligned in the optical system- this is demonstrated by the drosophila larvae in fig 2a, as it curls around. circle
Of course the (almost) non-invasive study of living organisms can provide significant information with regard molecular organisation, however to study a sample quantitively it must be examined in a number of orientations, whilst keeping still - something living dosophila larvae don't do!
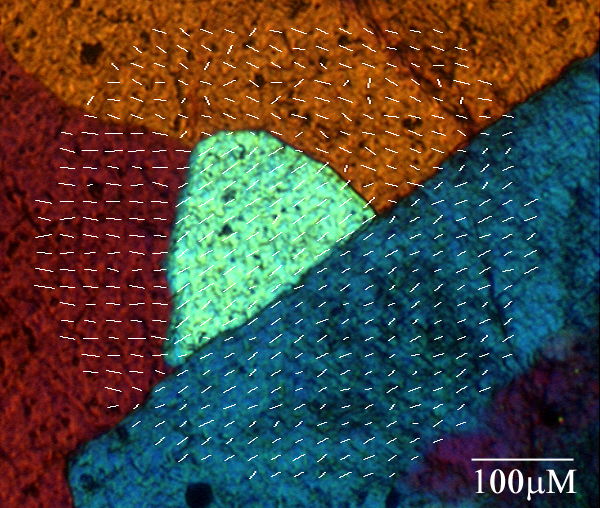
a) Thin section of granite viewed under polarised light. Hold the mouse over the image to see the corresponding orientation overlay.
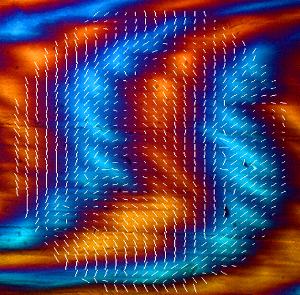
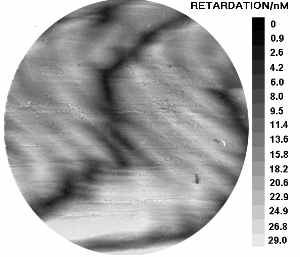
a) Dogfish egg case as viewed under polarised light. Hold the mouse over the image to see the corresponding orientation overlay. b) Image map representing the variation in relative retardation across the above sample.
To perform quantitative analysis using this technique, it is necessary to measure the relative intensity of a small area, as it is rotated relative to the polarisers. We have developed a computerised system for analysing larger areas, with our industrial partners Prior (microscopy), Datacell, and Ross research. A computer controls a motorised stage, and image aquisition card, allowing the capture and intensity analysis, of a sample at a number of orientations. The software (Image pro plus) is then able to compare the sample at each orientation to determine where the maximum and minimum intensities occur. From this data, the software can then create an overlay demonstrating molecular orientation (hold the mouse over the image to see this).
This technique has been applied to a range of different samples - mainly fixed biological liquid crystalline arrays, but also thin sections of stone.
The examples shown are of dogfish eggcasing collagen, and granite. To display the molecular orientation overlay, hold the mouse over the images, and it will appear.
Article first published 1999
Comments are now closed for this article