Large cities emit more CO2 and earn no more per capita than small cities, contradicting the ‘economy of scale’ that makes larger cities ‘greener’ than small ones and raising doubt over claims of other benefits Dr. Mae-Wan Ho
Allometric scaling relationships were first discovered in biology in the relative dimensions of parts of the body, as for example brain size and body size in the course of development and evolution [1]. It was later applied to metabolic rate of animals Y relative to body mass X [2] in the general form:
Y = AXb (1)
where A is a constant and b = ¾ the allometric exponent. A plot of log Y against log X gives the slope b and the intercept on the Y axis log A. The amazing thing is that it applies across kingdoms of the entire living world, from mouse to elephant (see Figure 1 from [3] Biology’s Theory of Everything, SiS 21 ) and even from bacteria to whales and giant redwood trees [4].
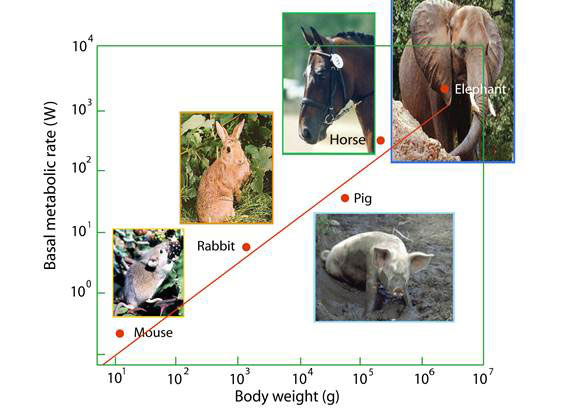
Figure 1 Allometric scaling of metabolic rate with body weight from mouse to elephant [3]
Recently, allometric scaling has been used to study cities, especially by theoretical physicists Geoffrey West and Luis Bettencourt at Santa Fe Institute in the United States [5, 6]. They found that cities across the US show allometric relations with population size. In particular, human activities can be grouped into 3 categories according to the value of the allometric exponent: isometric (b= 1) reflects individual human needs: number of jobs, houses, water consumption; sublinear (b < 1) implies an economy of scale with per capita measurement decreasing with population size, as in the number of gasoline stations, length of electrical cables, road surfaces, even greenhouse gas emissions; and superlinear (b > 1) implying positive per capita gain with population size in variables such as wages, income, gross domestic product, bank deposits and rates of invention (patents). Sublinear scaling indicates savings on infrastructure, while superlinear scaling indicates that larger cities are associated with increased levels of human productivity and quality of life (see [7] "Grand Unified Theory of Sustainability" for Cities? SiS 64) .
There has been intense debate over whether large cities are greener (reviewed in [8]). Some studies report that commuting makes a major contribution to greenhouse gas emissions. Consequently, compact cities would be greener by reducing the average commuting distance; but this has been hotly disputed, at least in the US on ground that a compact city would drive people to live outside the city and lengthen the commuting distance instead.
Erneson Oliveria, José Andrade Jr at Federal University of Ceara, Brazil, and Hernán Makse at City College of New York in the United States carried out a new study to see if larger cities are greener than smaller ones [8]. They used a new bottom-up approach combining two datasets on population and carbon dioxide emissions in continental USA, both the most finely detailed available. What they found was devastating: a superlinear scaling between CO2 emissions and city population, with average allometric exponent b = 1.46 across all cities in the US. In other words, doubling the size of cities leads to an increase of 146 % in CO2 emissions instead of 100 %. They concluded: “This result suggests that the high productivity of large cities is done at the expense of a proportionally larger amount of emissions compared to small cities.”
Why are the new findings so different? And why should we have more confidence in their results rather than those obtained previously by other?
First, the new findings are based on the most detailed databases for population and carbon emissions available, and second, a robust algorithm is used to identify cities, rather than relying on administrative definitions that often arbitrarily lump suburban and other outlying areas into cities.
The team started by aggregating settlements that are close to each other into cities using the City Clustering Algorithm (CCA). Then, they use the data of CO2 emissions at a fine geographic scale to determine the total emissions of each city.
Their results are substantially different from those obtained by the standard administrative definition of cities, i.e., Metropolitan Statistical Area (MSA), which display isometric scaling emissions or even sublinear scaling. This suggests that allometric studies based on administrative boundaries to define cities may suffer from inherent bias.
The carbon emission dataset is obtained from the Vulcan Project compiled at Arizona State University, and has a spatial resolution of 10 x 10 km (0.1deg x 0.1 deg grid) from 1999 to 2009. The data are separated according to economic sectors and activities: commercial, industrial and residential, electricity production, on-road vehicles, non-road vehicles (boats, trains, snow mobiles), aircraft, and cement.
The team analysed the annual average emissions in 2002 for total of all sectors combined and each sector separately. The choice of 2002 data is because that is the only year for which the quantification has been achieved at the scale of individual factories, power plants, roadways and neighbourhoods, and on an hourly basis.
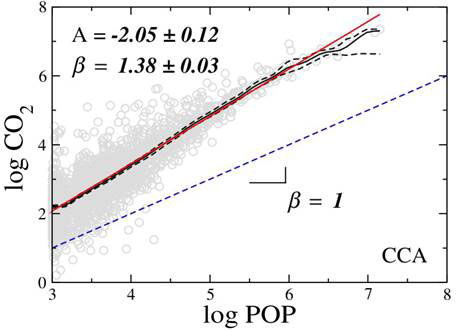
The CCA considers cities as constituted of contiguous commercial and residential areas (at cut-off distance l = 5 km and population threshold D* = 1 000) for which the emissions of CO2 are known from the Vulcan Project dataset. By using two microscopically defined datasets, the team could match precisely the population of each agglomeration to its rate of CO2 emission.
For l = 5 km and D* = 1 000, the plot of log (CO2) vs log (Pop) gives log A = -2.05 + 0.12 and b = 1.38 + 0.03, with R2 = 0.76. R is the correlation coefficient and the value of R2 is the proportion of the variation in CO2 that can be accounted for by the linear part of its relation with Pop (population); hence the closer it is to 1 for a positive slope, the better the fit to the model (Figure 2).
 CO
CO
Figure 2 Scaling of CO2 emission versus population. Solid red line the linear regression, grey circles the data points, solid black line the Nadaraya-Watson estimate of the unknown regression function (with dashed black lines the 95 % confidence interval of the estimate), dotted blue line is that of a theoretical regression with b = 1
How robust is the allometric exponent to the thresholds D* and l? Does it depend critically on the precise thresholds chosen? This was investigated by varying the values of the thresholds of l and D*and seeing how the allometric exponent b changes. The value of b was found to increase with l until a saturation value is reached at 10 km, which is relatively independent of D*. An average of the exponent values in the plateau region with l > 10 km over different D* gives b = 1.46 + 0.02. The CO2 emissions of each sector was also plotted separately to obtain the allometric exponents. The sectors with highest exponents (less efficient) are residential, industrial, commercial and electric production with b ranging from 1.46 to 1.62, above the average.
The team also made use of the US income dataset available from the US Census Bureau for the year 2000. The dataset provides the mean household income per capita for the 3 092 US counties. For each county, they combined the income data and the administrative boundaries in order to relate them with the geolocated datasets.
The allometric exponent of income per capita shows an inverted U-shape dependence on total income. In other words, the allometric exponent b decreases for the lower and higher income levels. The turning point is per capita income of $37 235 (in 2000 US dollars). The allometric exponent remains always larger than 1 (superlinear) regardless of income level, except for the lowest income.
When CO2 emissions are plotted separately for different income levels, there is a superlinear relation for all levels (b ranging from 1.23 at the highest income level to 1.43 at an intermediate level) except for the lowest < $25 119 (b = 0.92). After the turning point, b decreases indicating an environmental improvement in largest income cities. However, the allometric exponent remains larger than one throughout except for the lowest income level, indicating that almost all large cities are less green than small ones, no matter their income.
Comparison with allometric relations for area obtained for cities identified by MSA with cities identified by CCA shows that the MSA plot overestimates the area of cities, especially small cities. The MSA plot gives log AMSA = 0.81 +0.36 and bMSA = 0.51 + 0.06 (R2= 0.48). The CCA plot gives log ACCA = -2.86 +0.06 and bCCA = 0.94 + 0.01 (R2= 0.99). Hence the fit to the model based on CCA is much better than that based on MSA. There is nearly isometric scaling between population and area for CCA while the MSA plot shows a sublinear scaling. The CCA isometric relationship shows that the emission is independent of the population density, as expected, but leads to a superlinear scaling between emissions and population size. The MSA overestimates occupied area typically, and the bias is larger for small cities than larger ones; consequently, an overestimation of the CO2 emission of the small cities compared to larger cities. That accounts for a smaller allometric exponent for MSA than CCA for the plot of log (CO2) versus log (Pop), which give log AMSA = 1.08 + 0.38 and bMSA = 0.92 + 0.07 (R2 = 0.71).
The paper has omitted to plot income against city size, which would give a direct comparison with results obtained previously [5, 6]. At my request, the authors kindly provided such a plot of log income per capita versus log population (not shown).
The scaling exponent b = 0.017+ 0.006, with R2 = 0.014. In other words, there is very weak positive correlation between income and city size. That means per capita income is practically unchanged, or increases only slightly with city size; again at odds with the superlinear scaling found previously [4-6].
The new results show convincingly that larger cities are less green than smaller cities, and cast considerable doubt over previous analyses based on MSA cities, for which many other positive benefits have been claimed.
In my Prigogine Medal 2014 Inaugural Lecture for Sustainable City 2014 at University of Siena, 23 September 2014, I shall show how cities can become sustainable like organisms (for further details see: http://www.wessex.ac.uk/14-conferences/sustainable-city-2014.html).
Article first published 15/09/14
Comments are now closed for this article
There are 2 comments on this article.
Douglas Hinds Comment left 16th September 2014 15:03:59
The link provided was for the 9th International Conference on Urban Regeneration and Sustainability rather than the The Prigogine Gold Medal 2014 Award, the official Ceremony for which will take place on Tuesday 23rd September in Siena, Italy.
The url for that link is:
http://www.wessex.ac.uk/14-conferences/sustainable-city-2014/page-2.html
And states:
"This prestigious event is sponsored by the University of Siena on the occasion of the 9th International Conference on Urban Regeneration and Sustainability (The Sustainable City).
The Prigogine Medal was established in 2004 by the University of Siena and the Wessex Institute of Technology to honour the memory of Professor Ilya Prigogine, Nobel Prize Winner for Chemistry.
2014 Recipient - Mae-Wan Ho
The recipient of the 2014 Award will be Professor Mae-Wan Ho, founding Director of The Institute of Science in Society, an organisation that provides information about biotechnological issues as well as sustainability, climate change and in particular the nature of water."
In your closing sentence you mention:
"I shall show how cities can become sustainable like organisms"
That statement expands the conceptual framework of the interests we share (I have related to i-sis primarily in relation to the inherently uncontrollable risks posed by the biotech industry's recombinant products, fraudulent claims and manipulation of governments, public policy and the research agenda through bribes, infiltration, threats and vicious direct attacks on those that dare to expose their motives, methods and grave defects).
I too suggested that best logical path to achieving sustainability in cities was to conceive of them as if they were living organisms, whose distinct systems (i.e. neurological, circulatory, digestive, muscular, reproductive endocrine, skeletal etc.) must work together in harmony, including the needs of Rural Development within the equation also, give that Rural and Urban Development represent two sides of the same coin.
Beyond that, any divergence in perspective may well be complementary. My orientation focuses on the socially and environmentally rational aspects of agriculture, which is an equitable and integral activity by nature that has endured irrational impositions made by an unjust socio-economic-political system that privileges sociopathic and environmentally destructive agricultural production and distribution systems that we are going to change for the better, eventually.
Comment left 17th September 2014 05:05:48
I suspect the optiumum size for a Polis is about 150000 population max.This assumes competent design and integrity of construction.Which remain a theroretical gauge in practice.We have being given some hints however. As well clusters of such populations can be spaced so a transport ring connects them-for virtual megopolises.So long as fingers of wild lands and agriculture are mixed in,through and not choked with garbage.Buckminister Fuller's -Triton city proposals (with climate moderating dome over),are a good visualization.He pointed out ship yards could handle the needed construction standards.The building industry couldn't.That may not be the case today.