Living energies mini-series
The secret of life is not to be found in the molecular nuts and bolts in living organisms. Instead, it may be in how organisms use energy. This mini-series will hint at what lies in store, which gives concrete meanings to renewable living energy and sustainability.
Biology is promising its own unifying theory that explains all life, and the key is in how organisms use energy. Dr. Mae-Wan Ho investigates.
Naturalists have long observed that many living processes vary with the size of organisms. Bigger animals live at a more plodding pace, have slower heartbeats, longer lives, and grow more slowly. But the variation is far from random.
It was Max Kleiber, a Swiss agricultural chemist who first expressed this observation quantitatively in a paper published in 1932 on “Body size and metabolism”. He showed that the basal (resting) metabolic rate of mammals, from mouse upwards to elephant, varies with body weight according a simple mathematical equation, that came to be known as the ‘allometric scaling law’:
B = B0Ma
Where both a and B0 are constants.
A graph of log B against log M, gave a straight line with slope a, and intercept, log B0. The constant a was later assigned a value of ¾ in a book published in 1961, The Fire of Life, which was translated into many languages and widely used in university courses. This ‘mouse-to-elephant’ line became one of the best-known generalizations in bioenergetics, the study of energy relationship in living organisms.
Since then, hundreds of basal metabolic rates of both cold- and warm-blooded species have been measured, and all appear to confirm Kleiber’s relationship, especially the value of a, which is invariably ¾ or nearly so, over some 21 orders of magnitude of body weight, from bacteria to blue whales and giant redwoods.
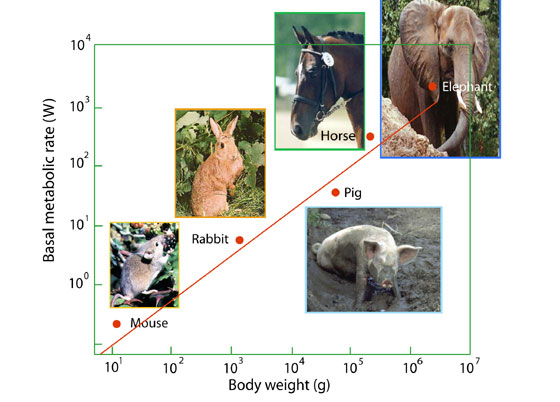
Figure 1. The mouse-to-elephant line
But no one had been able to offer a convincing explanation for this remarkable phenomenon until 1997, when Geoffrey West, a theoretical physicist from Los Alamos National Laboratory, teamed up with James Brown and Brian Enquist in the University of New Mexico, Albuquerque, to publish a paper in Science. In the paper, they derived the scaling relationship from first principles, not just for basal metabolic rate, but also for a range of other biological variables. For example, while basal metabolic rates of entire organisms scale as M3/4; rates of cellular metabolism, heartbeat, and maximal population growth scale as M-1/4; and times of blood circulation, embryonic growth and development, and life-span scale as M1/4.
The theory presented by West, Brown and Enquist is based on the simple fact that living organisms are maintained by transport of materials through networks such as the blood vessels in vertebrates, the trachea (transporting air) in insects, and the xylem and phloem (tubes transporting water and nutrients) in plants. These branching structures are optimised for their task, maximising the area across which they can take up and release resources and minimising the energy needed to transport those resources through the organism. Mathematically, such networks have fractal, self-similar geometry, i.e., they have fractional dimensions between the usual 1, 2, or 3; and the same or similar structure over many scales, from less than a micron to tens of metres.
Filling a three-dimensional volume with a network that maximises surface area available for capturing and releasing resources creates a four-dimensional geometric entity, and that is essentially why biological variables scale as quarter powers of the body weight.
It is interesting that self-similar fractal networks give minimum energy dissipation. In my book, The Rainbow Worm published in 1998 (see www.i-sis.org.uk), I proposed that organic space-time is fractal because it optimises energy transfer, based on thermodynamic arguments (see “Why are organisms so complex?” this series). Maybe there is a deep relationship that deserves further investigation.
The researchers have since used the theory to describe a range of biological phenomenon across, such as biomass production and variation in life-history of trees. Different plant life histories, with very different rates of growth and timings of sexual maturity, simply represent different ways of following the same law for optimum use of energy.
For example, in a study of more than 2 000 trees belonging to 45 species in a tropical dry forest over a period of 20 years, vastly different increases in diameter occurred. But, there was a trade-off in wood density, so that the faster growing trees had less dense wood. When the different tree diameters were adjusted for wood density, all the graphs of different species collapsed to a single line. And, despite the wide variation, production scaled as M3/4, the same as in animals.
That means plants have managed to evolve a great diversity of species of different sizes that can co-exist, simply by varying their strategy of growing at different rates, laying down wood of different densities and maturing at different sizes.
In yet another coup, the researchers teamed up with James Gillooly, who joined the University of New Mexico in 2000, and showed that all living organisms basically share the same resting metabolic rate when body size and temperature are taken into account.
Metabolism lies at the basis of all living activities. It is how the organism extracts energy from sunlight (in the case of green plants) or from food or nutrients to build up their bodies, to grow and develop and to do all the other things that constitute being alive.
So, when metabolic rates are adjusted for body mass and plotted against temperature, the model predicts that the data from any organism would yield a similar straight line with a universal slope.
The idea is quite simple. Basal metabolic rate B is the sum of many different biochemical reactions. The rate of each reaction depends on three major variables: concentration of reactants, fluxes of reactants and kinetic energy of the system. The first two variables are determined by the rates of supply of substrates and removal of products, and are the parts that depend on body weight M3/4. The last term contains the dominant temperature dependence, which is governed by the Boltzmann factor, e-E/kT. E represents the average activation energy for the biochemical reactions of metabolism. The combined effects of body size and temperature on metabolic rate is therefore approximately,
B ≈ M3/4 e-E/kT
The researchers found that metabolic rates, expressed per unit body weight, and plotted against temperature, resulted in very similar straight lines across the whole range of species. Data from 250 species, including copepods, sycamores, bananas, peas and fish were plotted, and each species closely resembled all the others, revealing a universal metabolic rate, said Geoffrey West.
Actually, they did not all have exactly the same resting metabolic rate, but the maximum difference separating any of the groups, is only about 20-fold. This is smaller than the variation in metabolic rate that can occur between exercise and rest in a single organism.
Many biologists are excited about these generalizations. Understanding the basic physical principles that govern metabolic rates for all organisms could help track the turnover of nutrients, such as carbon, in entire ecosystems, and how ecosystems sustain themselves.
Article first published 01/02/04
Comments are now closed for this article
There are 1 comments on this article.
Prof A Mafadyen Comment left 4th September 2014 00:12:04
A very enlightening synthesis of ideas which, although not new individually, are well expressed and easy to understand.